memtrail is a LD_PRELOAD based memory profiler and leak detector for Linux.
There are already many other open-source memory debugging/profiling tools for Linux, several of which are listed on Links section below, and the most powerful arguably being Valgrind. However, I needed a tool that could quantify leaks and identify memory hogs, for long-running and CPU intensive workloads, which simply run too slow under Valgrind's dynamic binary instrumentation, hence this project.
-
Very little runtime overhead
-
Will immediately output maxmimum memory allocated and total leaked memory at the end of program execution.
-
Text trees show callstacks for memory consuption or leaks
-
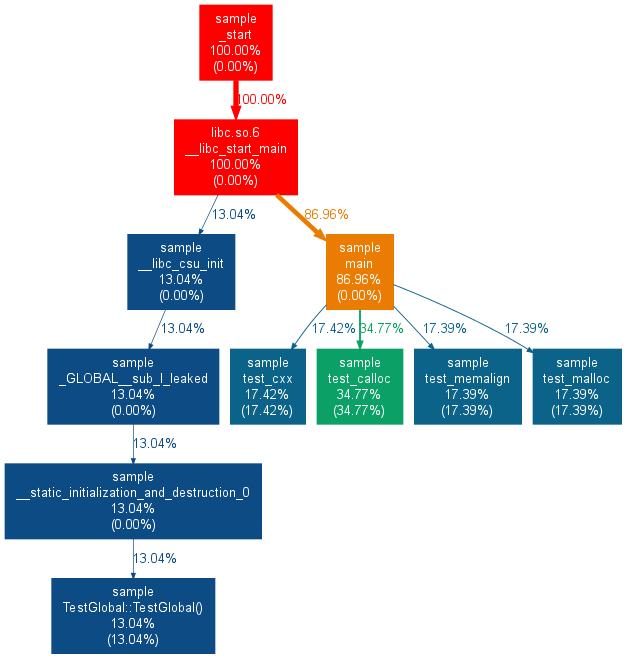
Can produce graphs showing flow of memory consumption or leaks
-
Linux
-
Python 2.7
-
gzip
-
For best results (performance/stability) configure libunwind and build as
./configure --disable-cxx-exceptions --disable-debug-frame --disable-block-signals --disable-shared --enable-static --with-picadd set
UNWIND_SRCenvironment variable to where the libunwind source is. -
gprof2dot for graph output
make
Run the application you want to debug as
memtrail record /path/to/application [args...]
and it will generate a record memtrail.data in the current
directory.
View results with
memtrail report
It will produce something like
maximum: 5890 bytes

->34.77% (2048B): test_calloc
| ->34.77% (2048B): main
|   ->34.77% (2048B): __libc_start_main
|     ->34.77% (2048B): _start
|
->17.39% (1024B): test_memalign
| ->17.39% (1024B): main
|   ->17.39% (1024B): __libc_start_main
|     ->17.39% (1024B): _start
|
->17.39% (1024B): test_malloc
| ->17.39% (1024B): main
|   ->17.39% (1024B): __libc_start_main
|     ->17.39% (1024B): _start
|
-> 8.69% (512B): TestGlobal::TestGlobal()
| -> 8.69% (512B): __static_initialization_and_destruction_0
|   -> 8.69% (512B): _GLOBAL__sub_I_leaked
|     -> 8.69% (512B): __libc_csu_init
|       -> 8.69% (512B): __libc_start_main
|         -> 8.69% (512B): _start
|
-> 8.69% (512B): test_cxx
| -> 8.69% (512B): main
|   -> 8.69% (512B): __libc_start_main
|     -> 8.69% (512B): _start
|
-> 8.69% (512B): test_cxx
| -> 8.69% (512B): main
|   -> 8.69% (512B): __libc_start_main
|     -> 8.69% (512B): _start
|
-> 4.35% (256B): TestGlobal::TestGlobal()
| -> 4.35% (256B): __static_initialization_and_destruction_0
|   -> 4.35% (256B): _GLOBAL__sub_I_leaked
|     -> 4.35% (256B): __libc_csu_init
|       -> 4.35% (256B): __libc_start_main
|         -> 4.35% (256B): _start
|
-> 0.02% (1B) in 2 places, all below the 1.00% threshold

memtrail.maximum.json written
You can then use gprof2dot.py to obtain graphs highlighting memory leaks or
consumption:
gprof2dot.py -f json memtrail.maximum.json | dot -Tpng -o memtrail.maximum.png
It is also possible to trigger memtrail to take snapshots at specific points by
calling memtrail_snapshot from your code:
#include "memtrail.h"

...

   memtrail_snapshot();
Memory debugging:
Memory profiling:
