Data
Plateau "real-time" data:
Conversion tools gml → geojson
- https://github.com/GeoPythonJP/citygml-convert-tools
- https://ozekik.github.io/plateaukit/cli/convert/
A collection of various data visualizations related to Japan's real estate situation
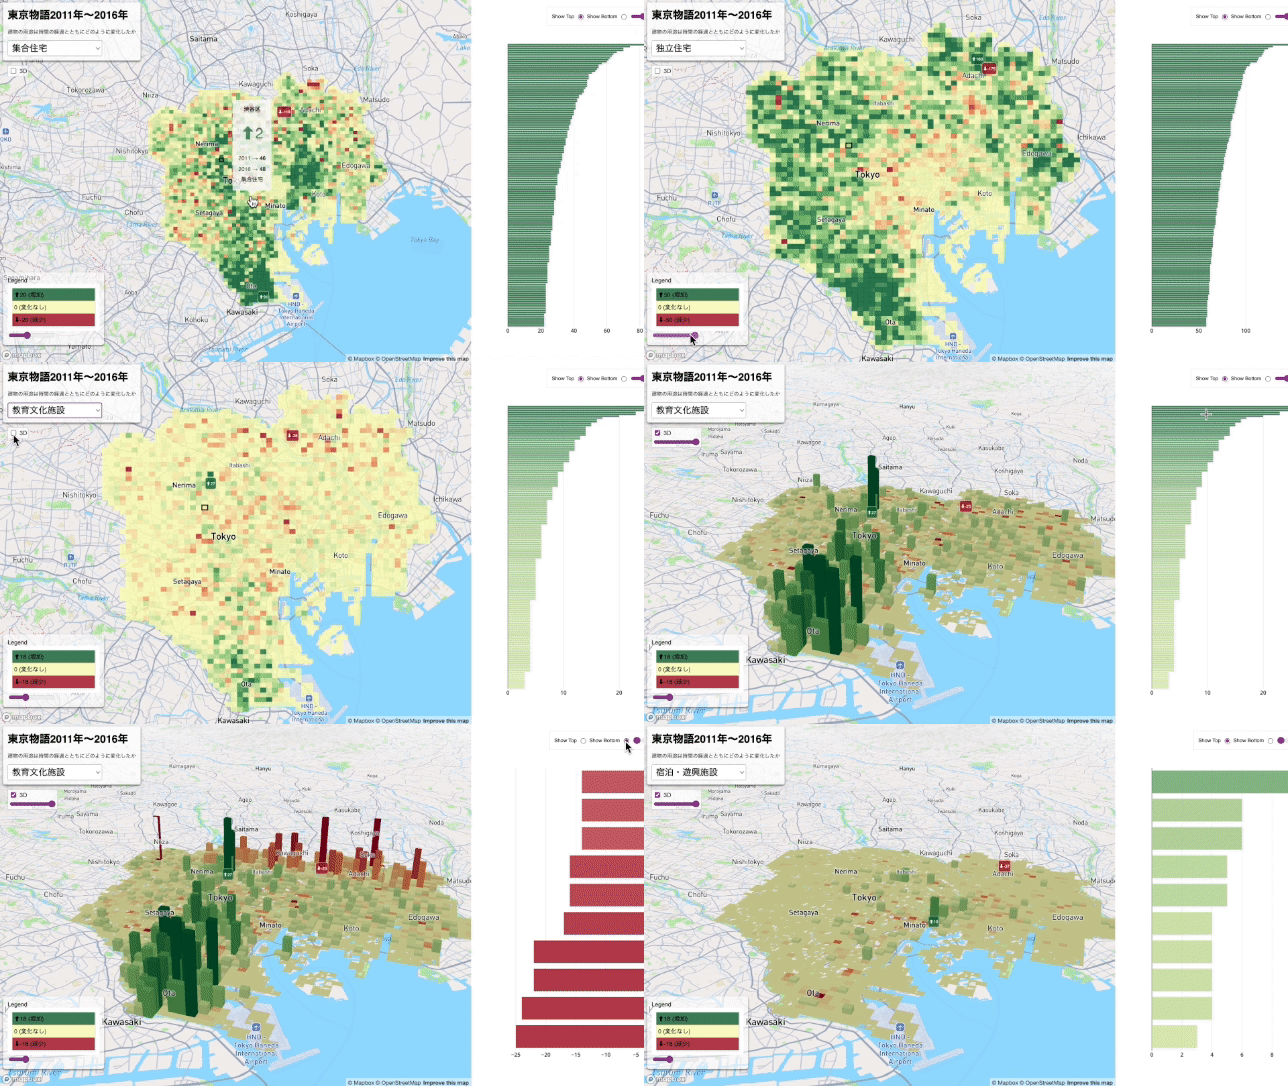
- added 3D mode
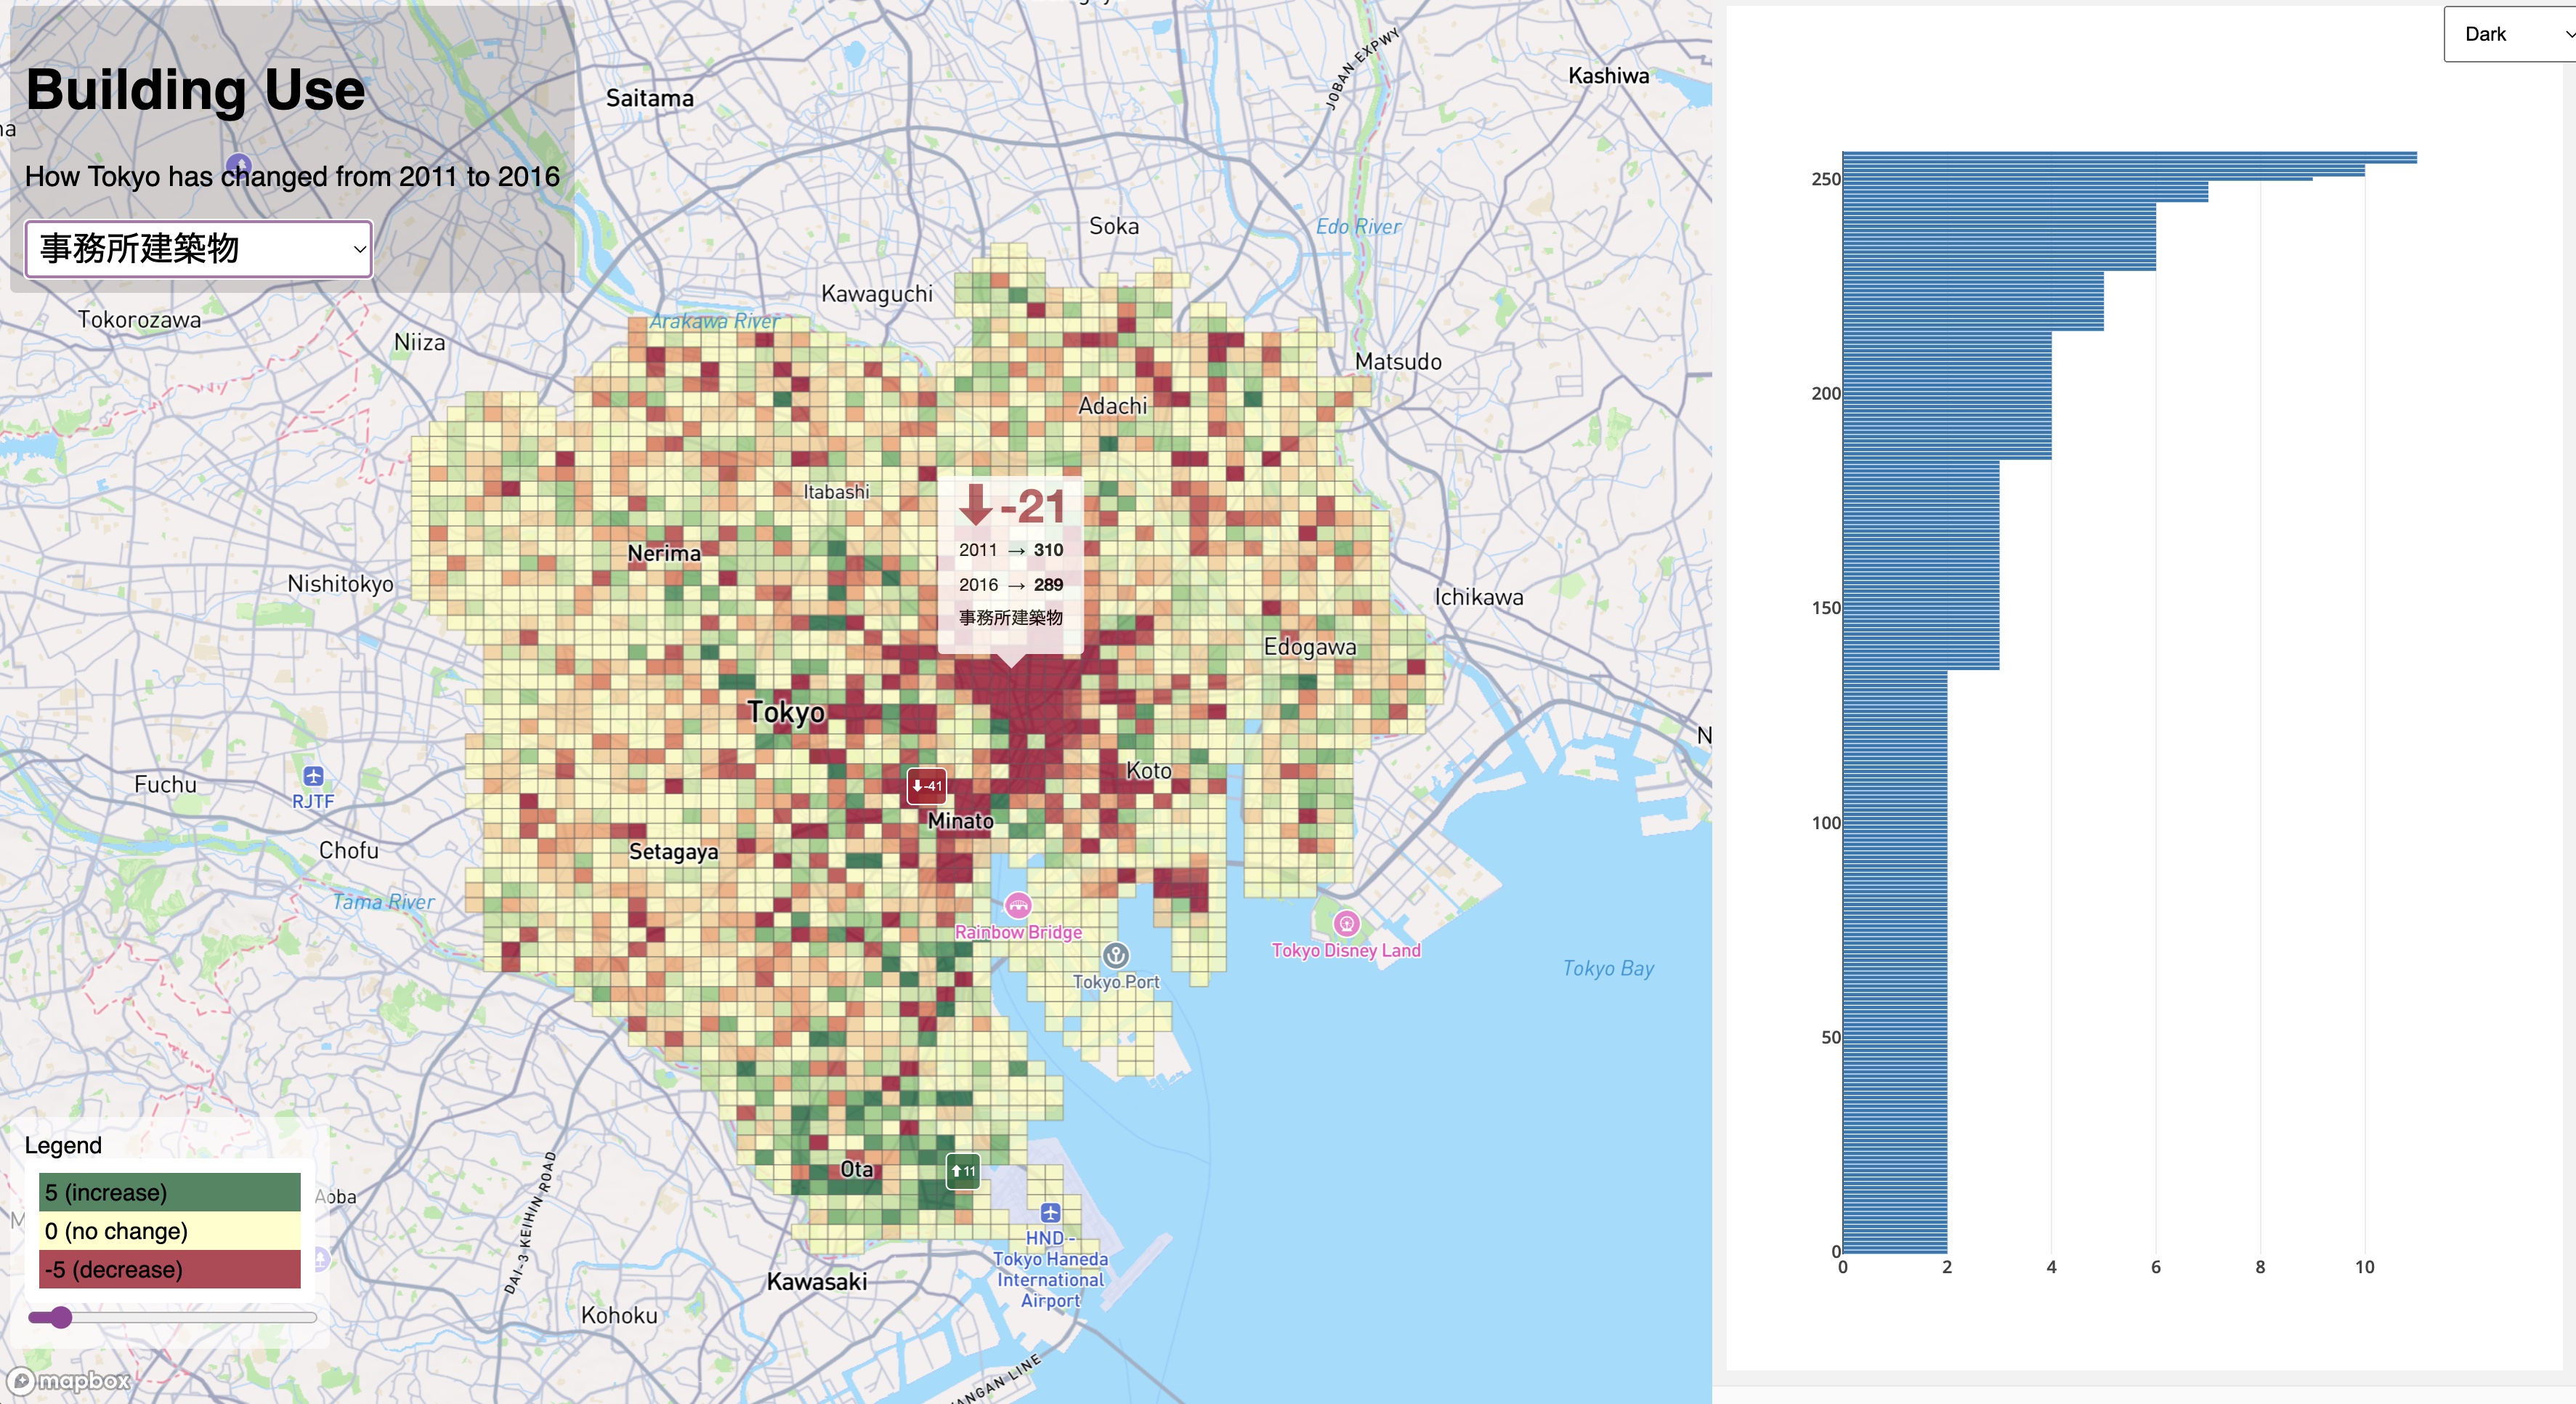
- color coded bar charts to match map bin colors
What has changed from 2011 to 2016?
https://yohman.github.io/xymax/buildinguse_change/
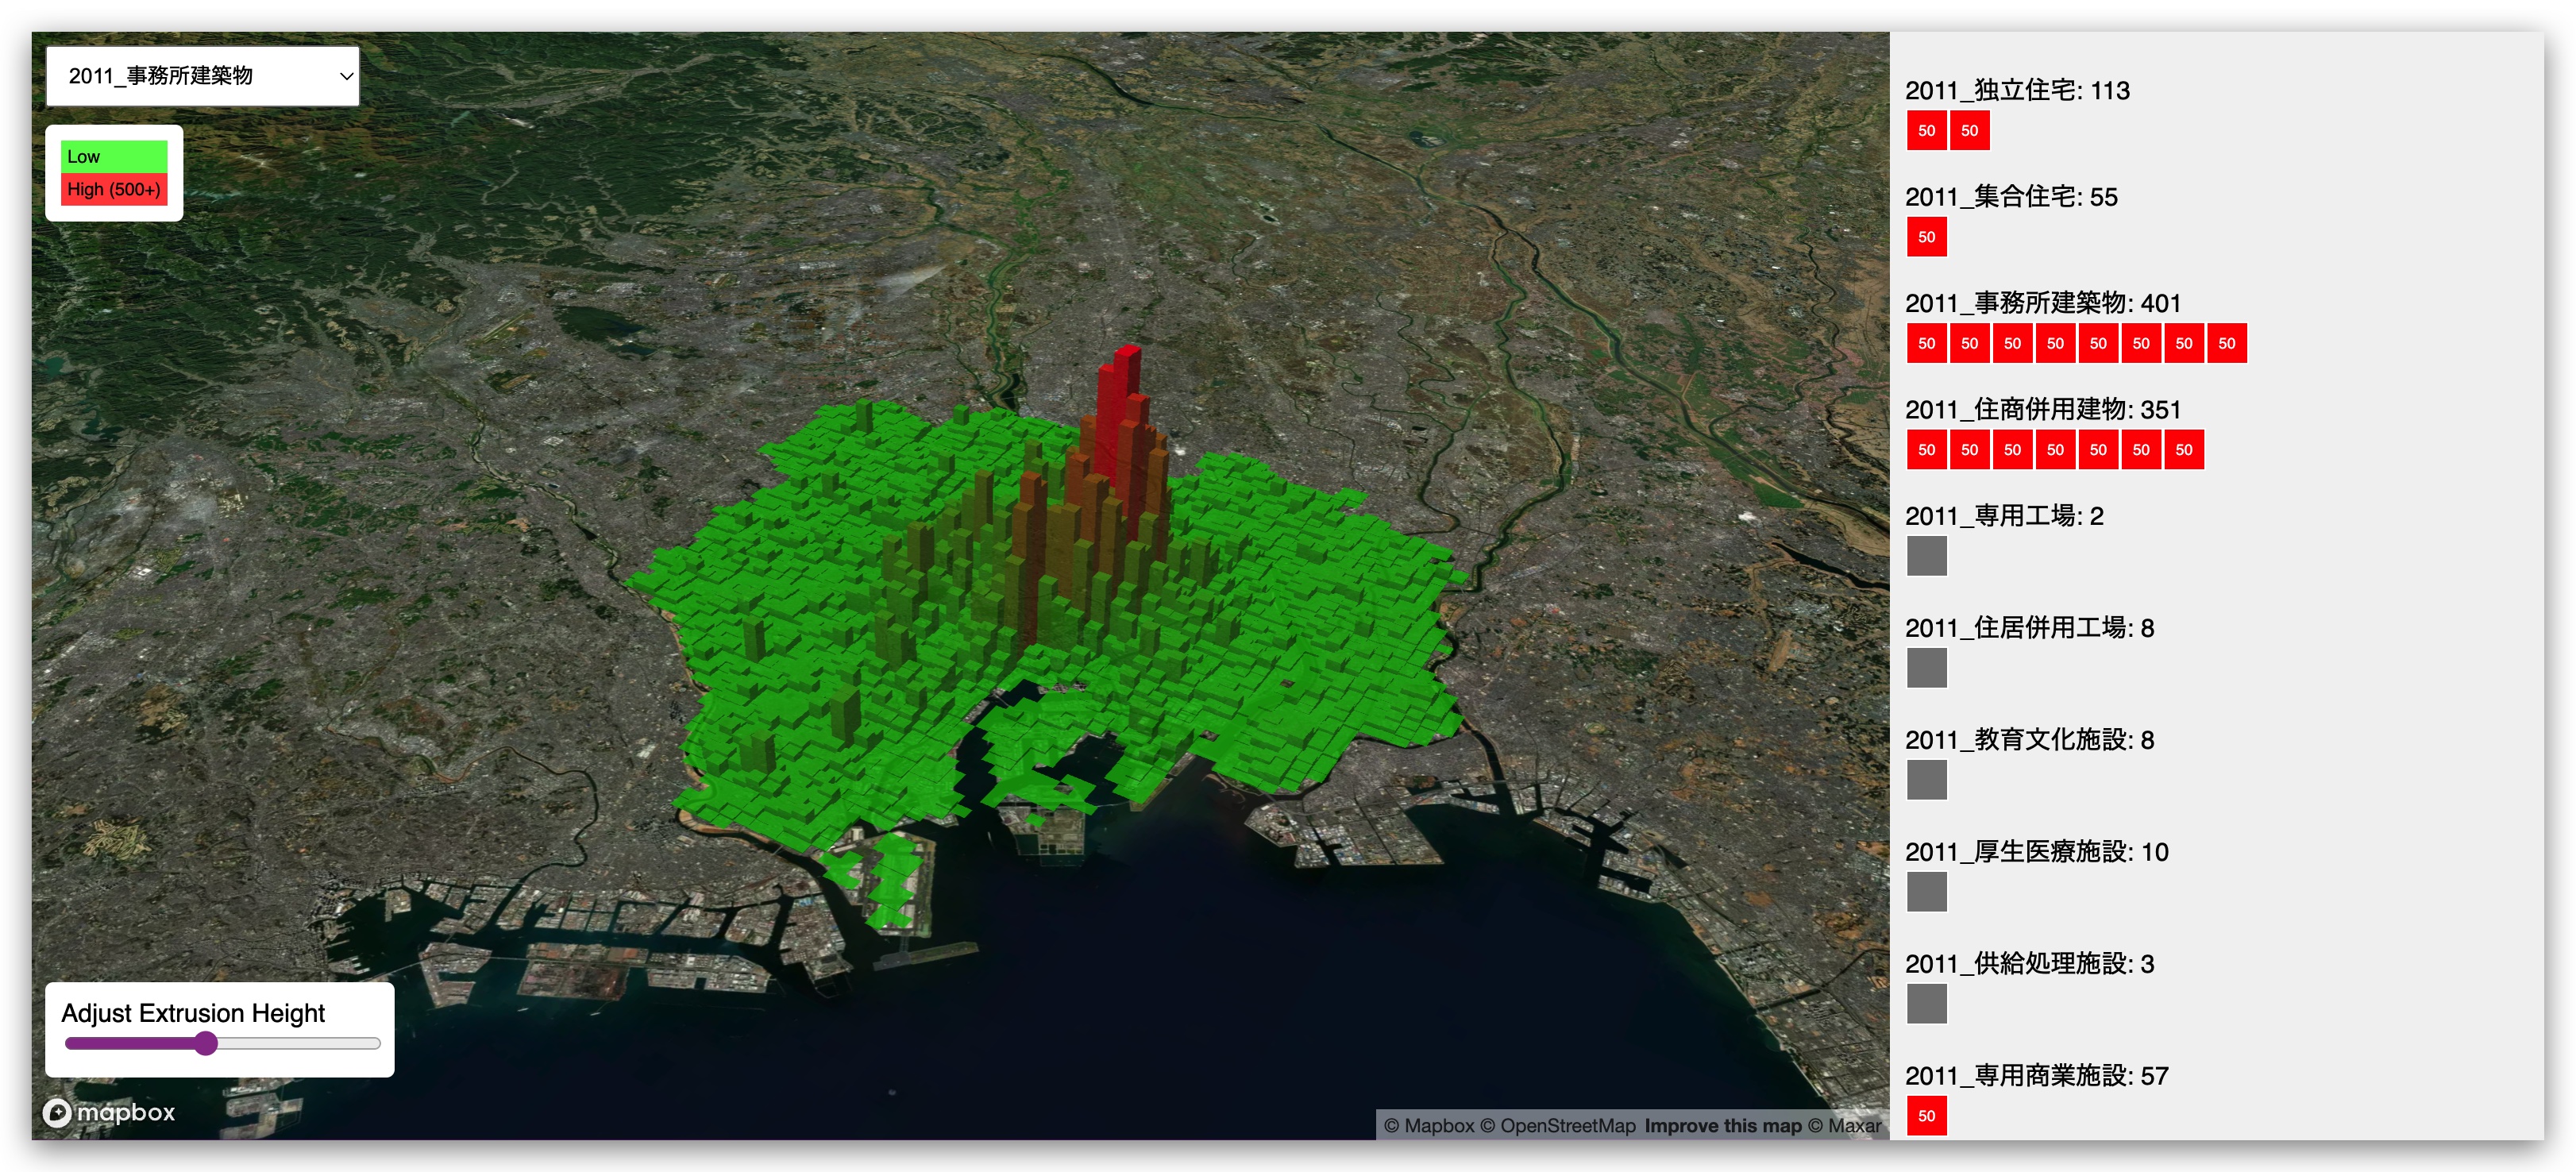
Where are different building uses located in Tokyo?
https://yohman.github.io/xymax/buildinguse/
- Left (yellow): 2001 buildings
- Right (purple): 2011 buildings
- Height is based on area (larger footprint = taller polygon)
- Swipe (left ⇔ right)


