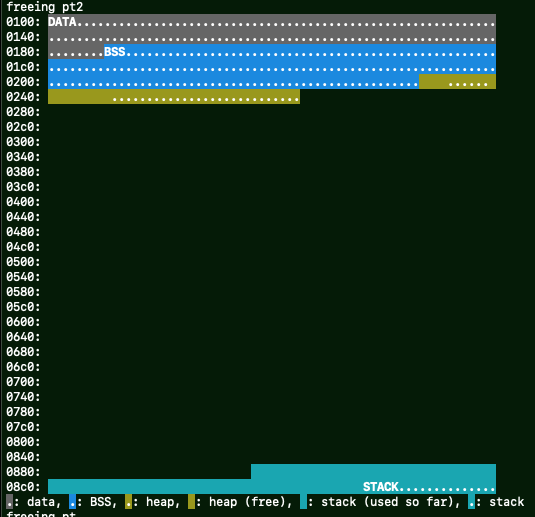
This is a simple, text-based tool designed to visualize heap and stack utilization for Arduino devices, particularly those using the AVR5 architecture (e.g., the Uno or ATmega328).
As is well known, the Arduino Uno has only 2 kilobytes of RAM, which is shared among the data, BSS, heap, and stack sections. Specifically, the heap grows from lower addresses, while the stack grows from higher addresses, both moving toward the middle of the RAM. This makes managing memory crucial, as excessive heap or stack usage can cause unexpected behavior, which is often difficult to diagnose.
This tool consists of two parts:
- The helper code that runs on the Arduino (written in C++), which outputs diagnostic information when specific helper functions are called.
- A Python script that runs on a PC, which decodes this diagnostic information and visualizes it in a text terminal using color.
Note: This software is still under development. Bugs are possible, but I plan to continually improve the software. Feedback, improvements, and forks of the repository are welcome.
In the arduino_heap subdirectory, compile and upload the code to an Arduino Uno.
(Tested with Arduino IDE version 1.8.19.)
arduino_heap.ino: a sample programheapmon.cpp: the helper codeheapmon.h: the header file for the helper code
You will need a recent version of Python 3. I tested the script with Python 3.9.11 on macOS.
Additionally, you will need to install two libraries via pip:
pyserialtermcolor
A requirements.txt file is also available for easy installation.
In the visualizer_python subdirectory, running python3 visualize.py -h will show the following help message:
usage: visualize.py [-h] [-b SERIAL_SPEED] [-R] port

Heap and Stack Utilization Visualizer for Arduino (Uno)

positional arguments:
  port                  Arduino serial port (e.g. /dev/tty0)

optional arguments:
  -h, --help            show this help message and exit
  -b SERIAL_SPEED, --baud SERIAL_SPEED
                        serial port speed (baud rate) (default: 115200)
  -R, --force-color     Force ANSI color even if stdout is not a tty
                        (default: False)
Running visualize.py will produce a visual output similar to the one below:
Note: If you are unfamiliar with terms like BSS, data, heap, or stack, please consult online tutorials.
Example: Arduino Memory Guide | Arduino Documentation
The hexadecimal numbers on the left represent the starting memory (RAM) addresses for the corresponding memory dump shown on the right.
Each character in the dump corresponds to one byte of memory.
-
data: section containing constant values
-
BSS: section containing global (and static) variables
-
heap: dynamically allocated memory (e.g., via
malloc()orrealloc())Arduino's
Stringtype allocates memory on the heap. Excessive use ofStringcan easily lead to memory exhaustion, even if it doesn’t seem excessive.- Dotted areas (
...) in the heap represent actively allocated memory. - Non-dotted areas are free and unused but may be fragmented, which can lead to memory inefficiency.
- Dotted areas (
-
stack: stores local variables and handles function call nesting and interrupts (ISR). The top of the stack is referred to as the stack pointer (SP).
On the AVR architecture, the stack pointer points to the memory address just before the current top of the stack.
-
Dotted areas in the stack represent active memory used by local variables or function calls. The data shown reflects the state at the time
heapmon_print_stats()was called. -
Non-dotted areas are not currently in use but may have previously conflicted with heap usage. Developers should monitor maximum stack utilization to avoid potential issues.
-
- Some hardware (or processor architecture) information is hard-coded into both the C++ and Python scripts.
- Stack usage estimates represent an approximation. Accurate determination of maximum stack usage is difficult, and the estimation algorithm may require further improvements.
-
heapmon_fill_stack(): This function is optional but necessary to estimate maximum stack usage. It should be called early in thesetup()function. -
heapmon_print_consts(): This mandatory function should be called afterSerial.begin(). -
heapmon_print_stats(): This key function prints the current heap and stack usage. It should be called whenever you suspect memory usage has changed, particularly at the deepest levels of function nesting to record maximum stack usage.
void A() {
    B();
}

void B() {
    C();
}

void C() {  // Deepest level of function nesting (A() -> B() -> C()).
    // some code
    heapmon_print_stats();
}(c) Copyright 2023, Atsushi Yokoyama, Firmlogics

