This is a sample solution for logging EC2 Spot Instance Interruptions, storing them in CloudWatch and S3, and visualizing them with a CloudWatch Dashboard and Amazon Athena.
Tracking Spot Interruptions can be useful when done for the right reasons, such as evaluating tolerance to interruptions or conducing testing. However, frequency of interruption, or number of interruptions of a particular instance type, are examples of metrics that do not directly reflect the availability or reliability of your applications. Since Spot Interruptions can fluctuate dynamically based on overall Spot Instance availability and demand for On-Demand Instances, tracking interruptions often results in misleading conclusions. Because of this, it's recommended that this solution be used for those situations where Spot Interruptions inform a specific outcome, as they do not accurately reflect system health or availability.
We recommend reading this blog post for more information on Best Practices for Handling EC2 Spot Interruptions.
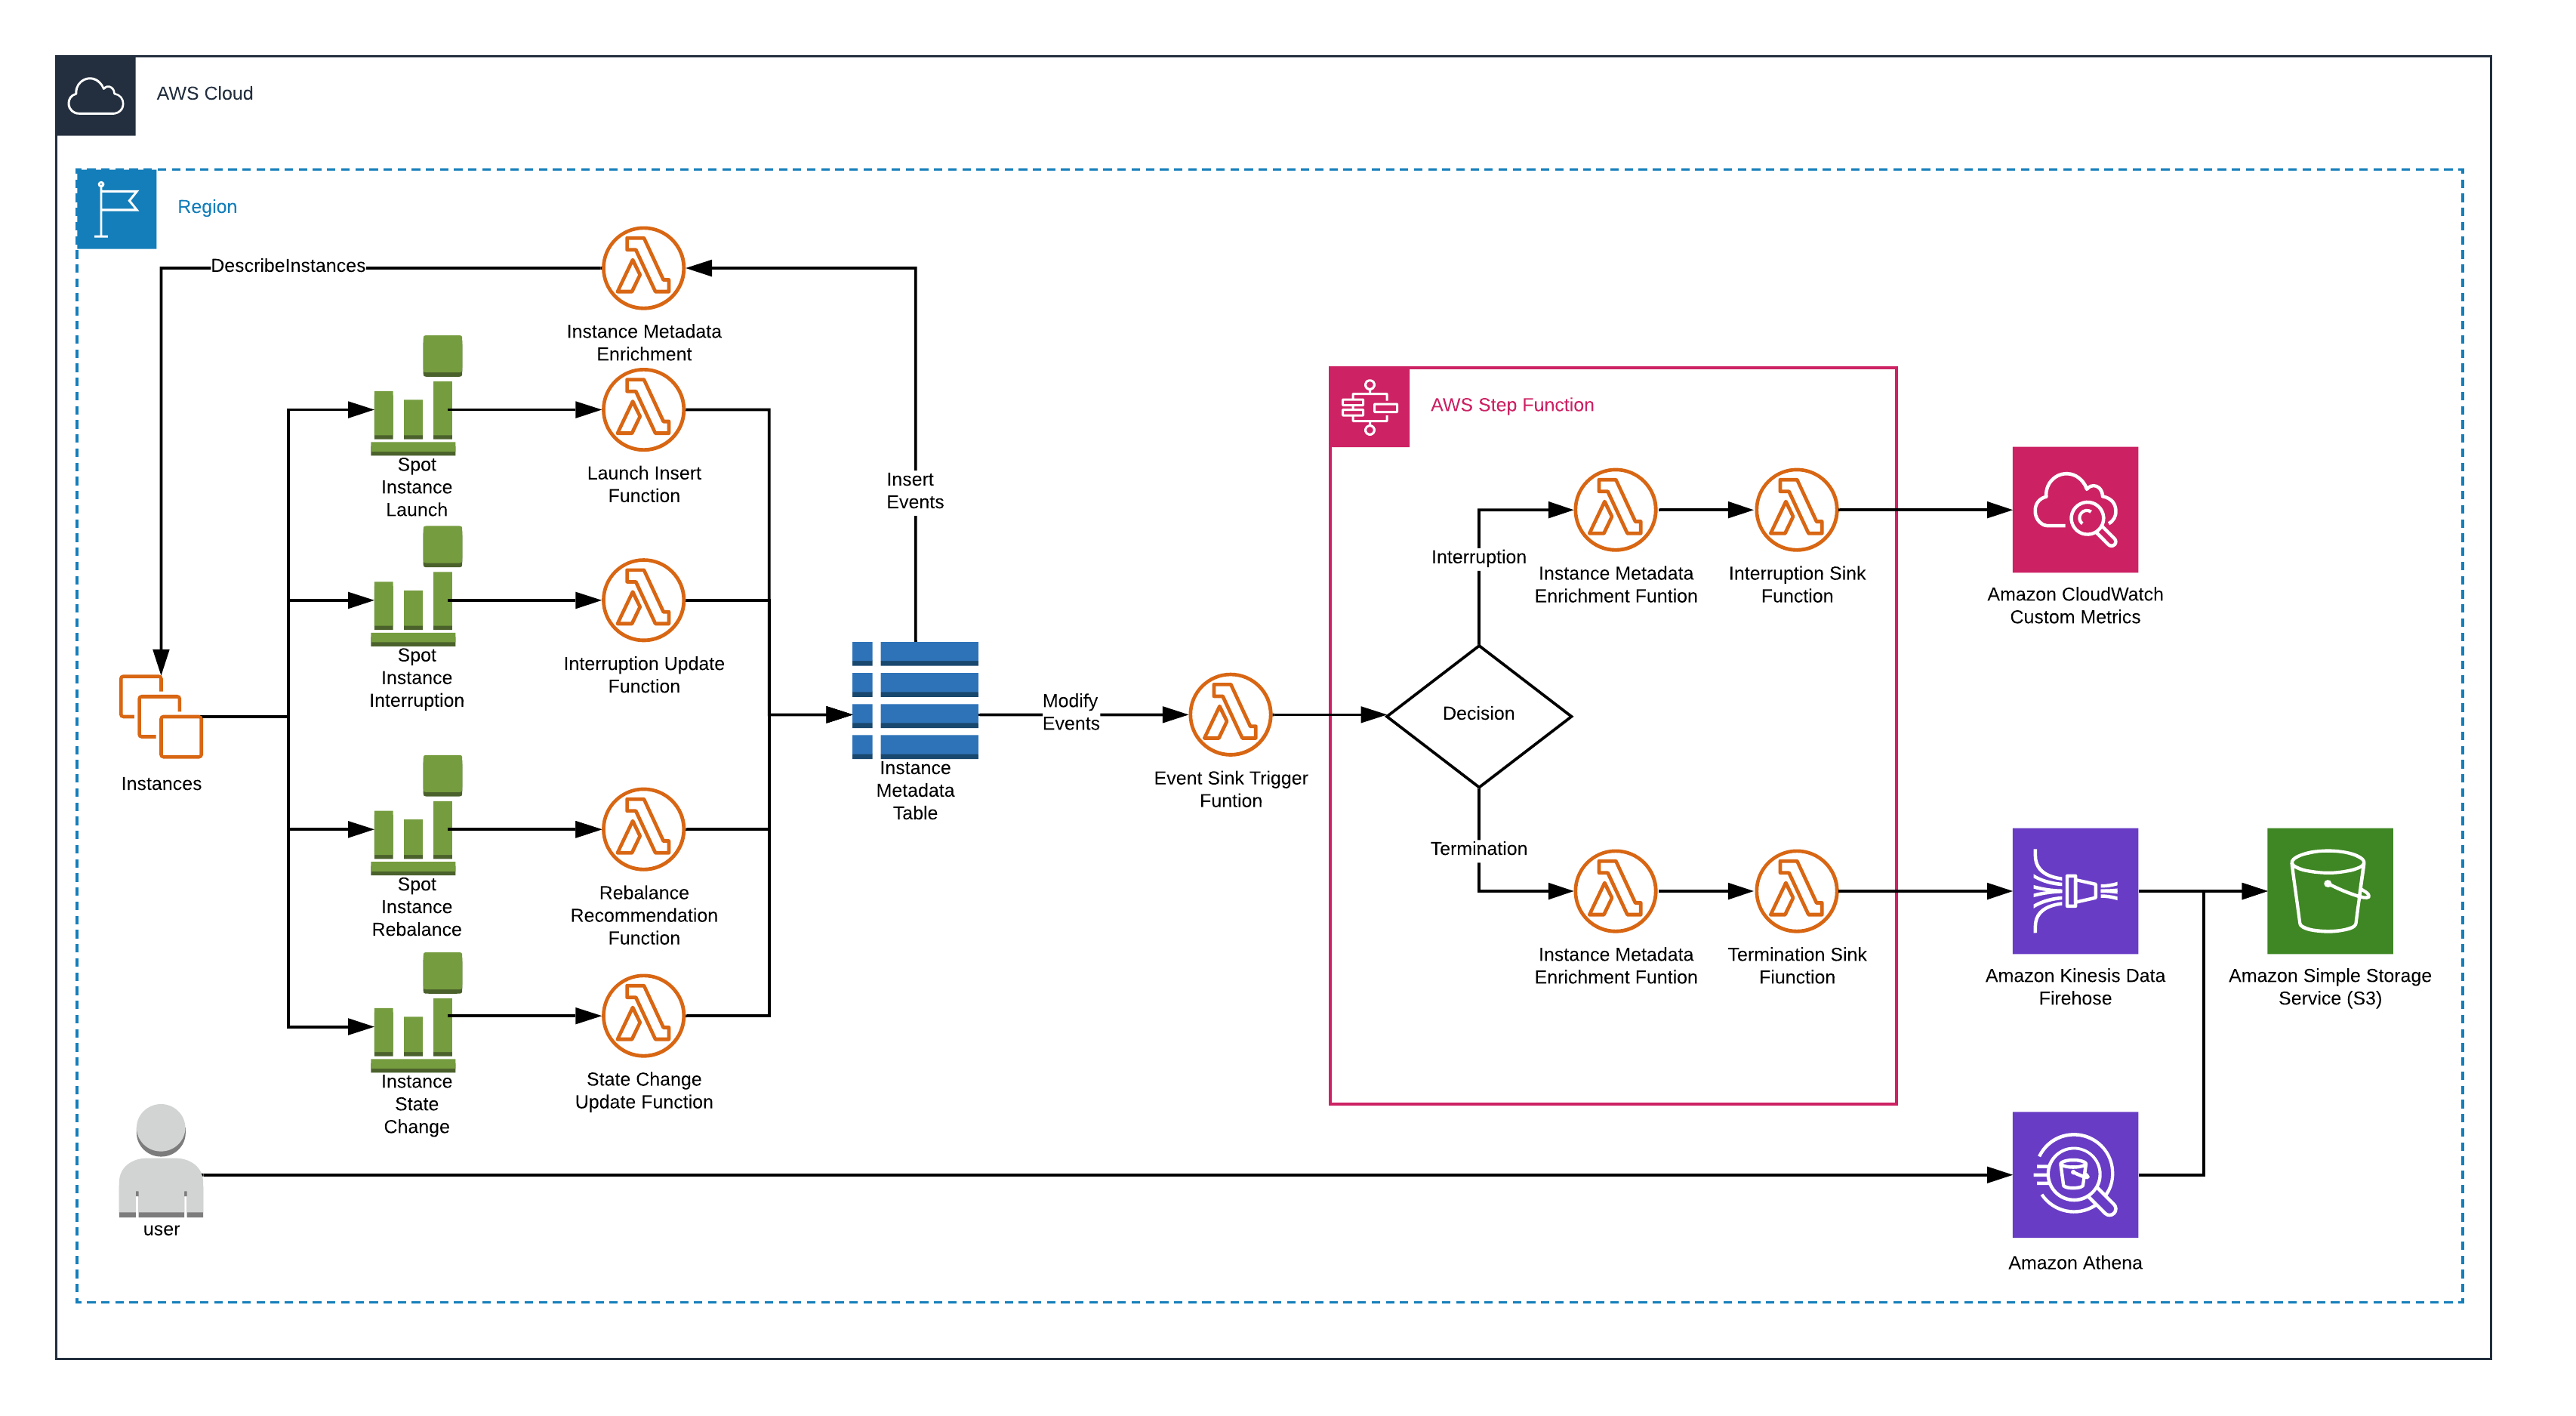
This solution captures 3 types of events (Spot Launches, State Changes, Spot Interruptions), and keeps the current state of EC2 instances cached in DynamoDB. When new instances are inserted into DynamoDB (Through Spot Launch or State Change Events), an Instance Metadata Enrichment function is exected to describe more details about the instance and store those details in DynamoDB. This builds an eventually consistent view of instance details, and enforces best practices such as pagination to reduce the chance of Describe API throttling.
When an instance is Interrupted, a Step Function is executed that stores interruption data in CloudWatch in the form of a custom metric. This data is used to build a dashboard (the solution deploys a example dashboard, and you can extend this or create your own), showing interruption data by Instance Type and Availability Zone.
When an instance is Terminated, a Step Function is executed that stores termination data in CloudWatch in the form of JSON data that can be queried with Athena (the solution deploys example Athena Queries, and you can create your own).
NOTE: This solution is regional (you need to deploy it in each region you want to cature data within), and only captures instances launched after it is deployed.
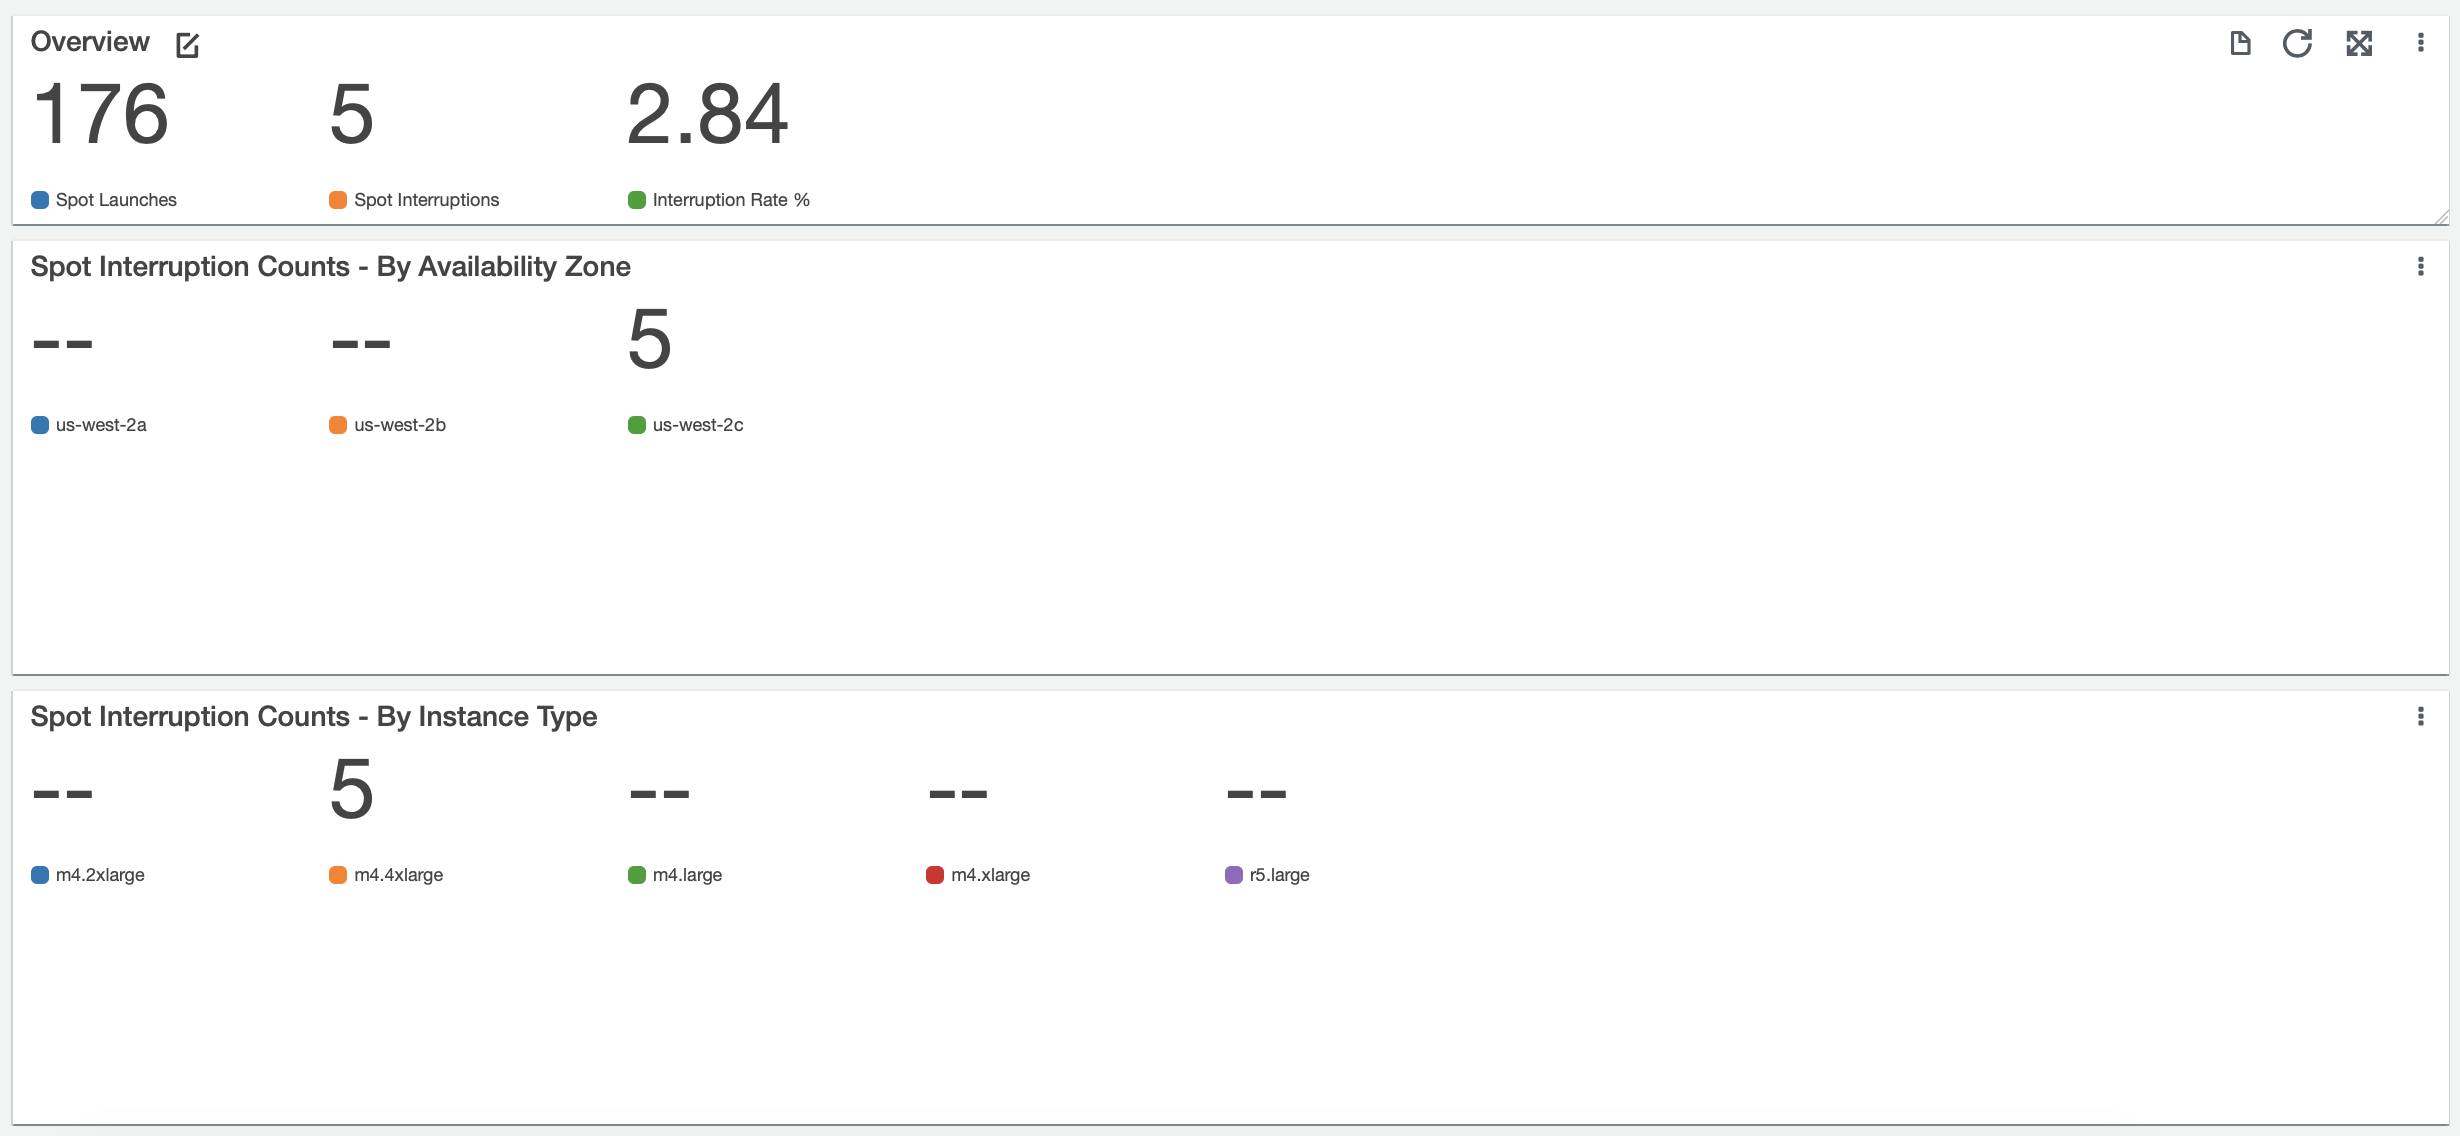
The solution deploys an example CloudWatch Dashboard that will display interruptions by Availability Zone and Instance Type. This dasboard will dynamically build-out and populate as instances are interrupted.
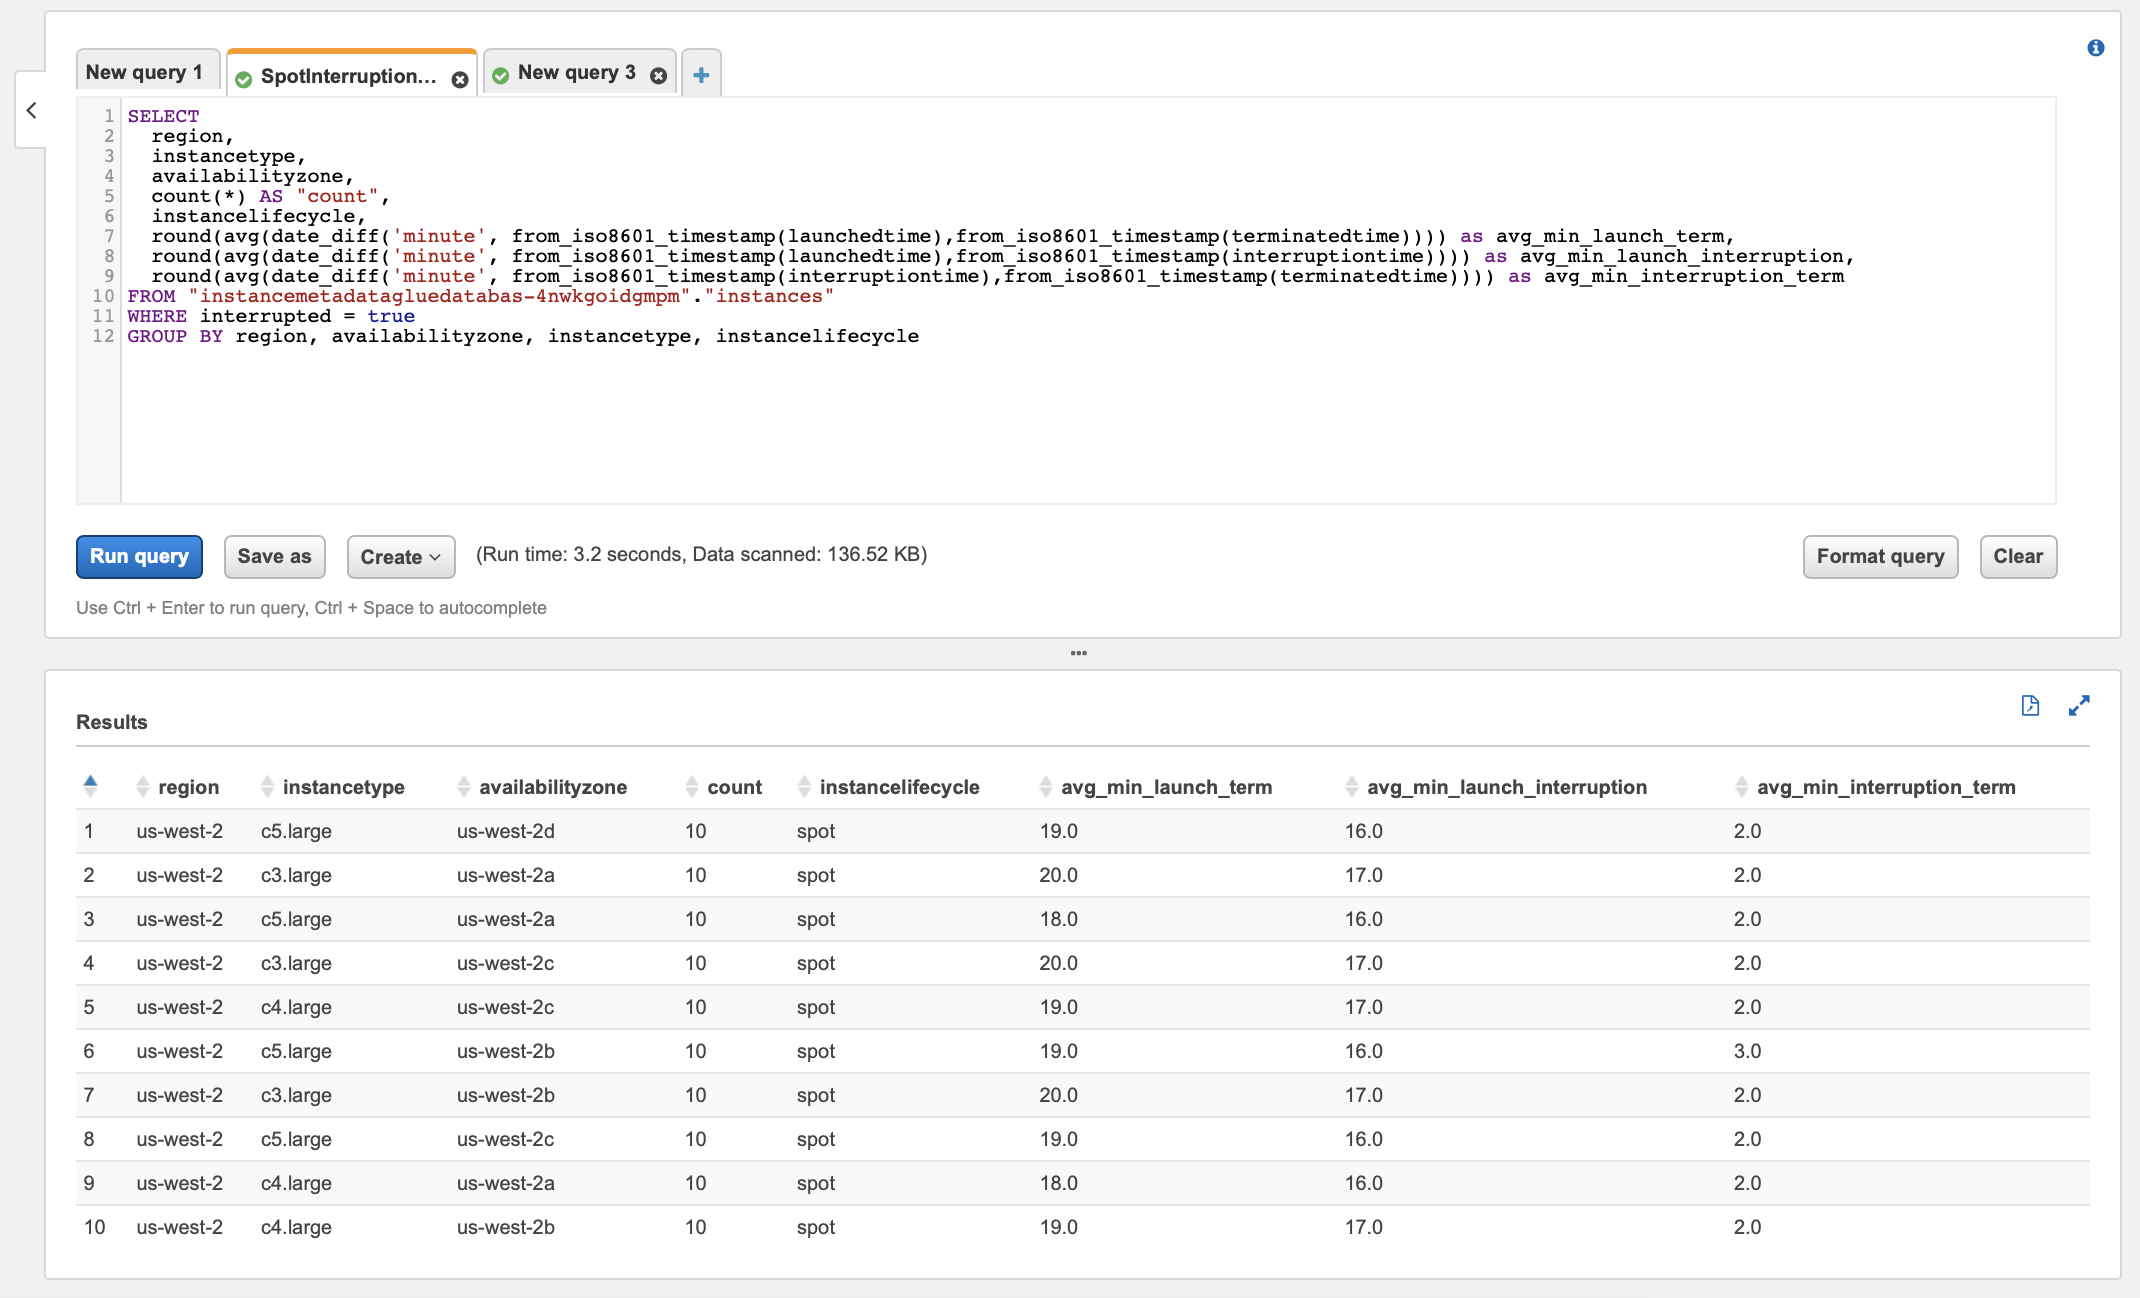
This soution deploys example Athena queries that can be used to report on Instances that have been terminted (and Interrupted).
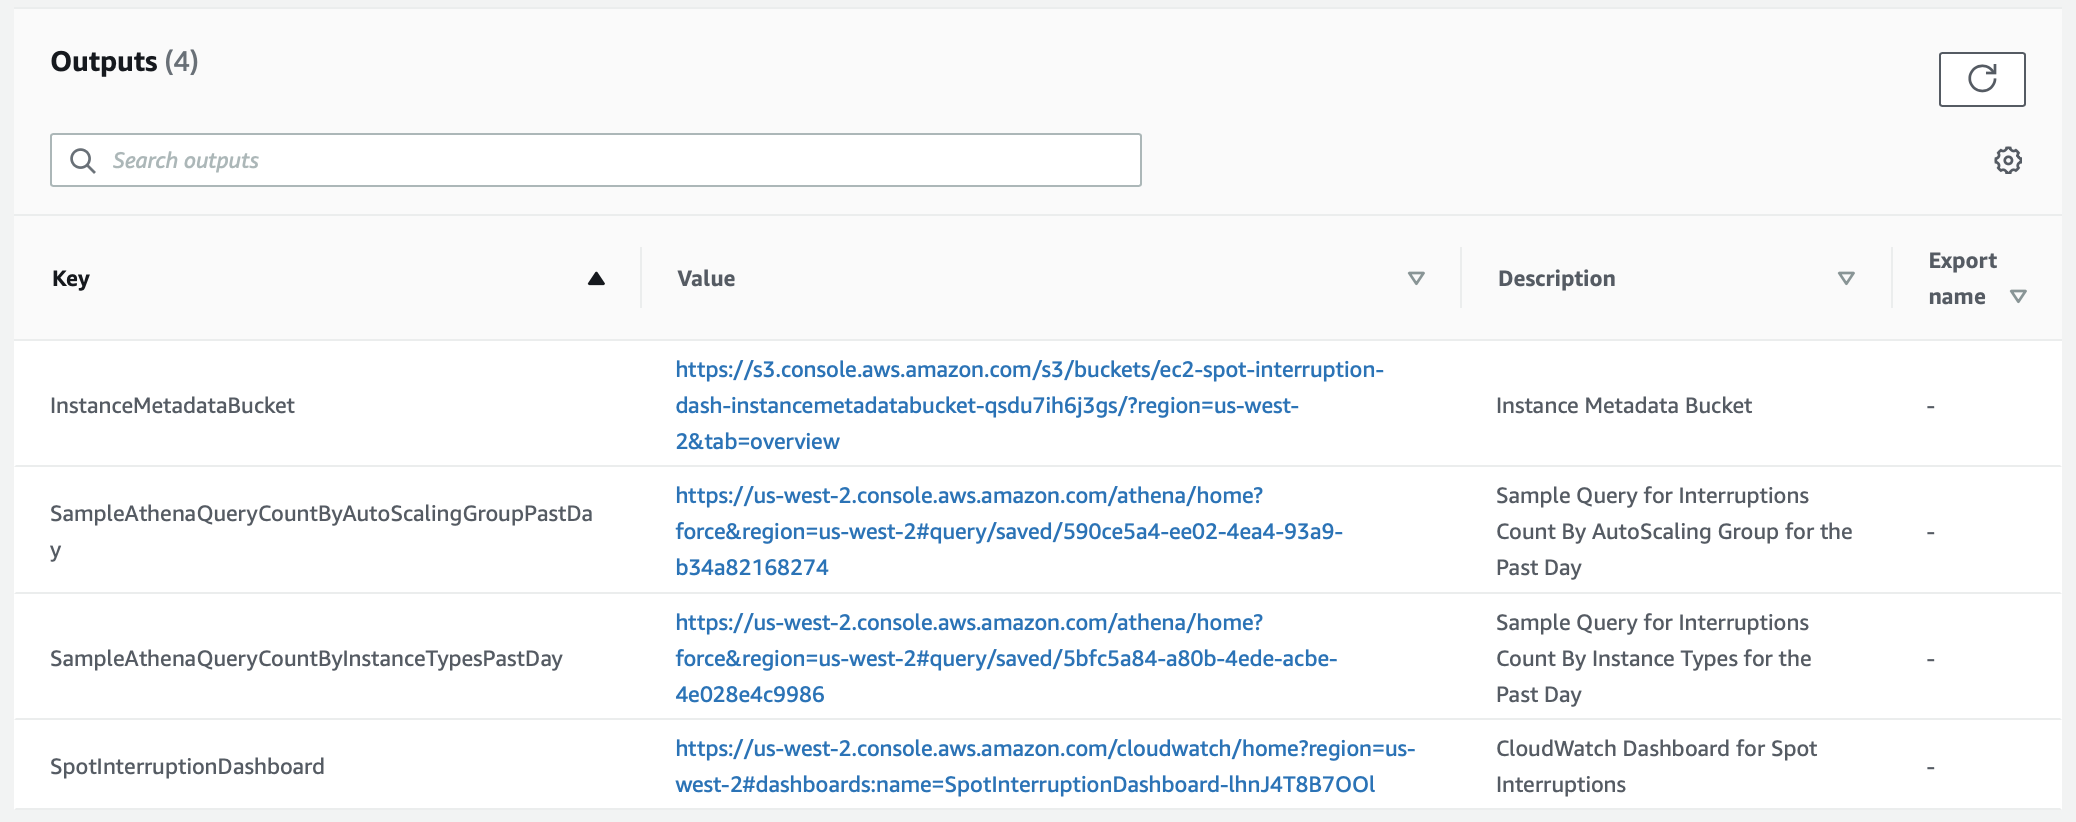
You can access links to the example CloudWatch Dashboard and Athena Queries from the outputs of the CloudFormation Stack.
This solution captures some common information about instances that may be relenvant to you, such as Instance Type, Availability Zone, Instance Lifecycle. You can customize this solution in two places to enrich the data that is stored in DynamoDB, and S3.
- InstanceMetadataEnrichmentFunction - This function enriches the instances that are stored in DynamoDB. You can customize this function to store additional data.
- DataSinkInterruptionEnrichmentFunction - This function can be used to enrich data before it is sent to Cloud Watch when Interruptions occur.
- DataSinkTerminationEnrichmentFunction - This function can be used to enrich data before it is sent to S3 when Terminations occur.
Note: For easiest deployment, create a Cloud9 instance and use the provided environment to deploy the function.
- AWS CLI already configured with Administrator permission
- Python 3 installed
- Docker installed
- SAM CLI installed
Once you've installed the requirements listed above, open a terminal sesssion as you'll need to run through a few commands to deploy the solution.
Firstly, we need a S3 bucket where we can upload our Lambda functions packaged as ZIP before we deploy anything - If you don't have a S3 bucket to store code artifacts then this is a good time to create one:
aws s3 mb s3://BUCKET_NAMENext, clone the ec2-spot-interruption-dashboard repository to your local workstation or to your Cloud9 environment.
git clone https://github.com/aws-samples/ec2-spot-interruption-dashboard.git
Next, change directories to the root directory for this example solution.
cd ec2-spot-interruption-dashboard
Next, run the folllowing command to build the Lambda function:
sam build --use-containerNext, run the following command to package our Lambda function to S3:
sam package \
    --output-template-file packaged.yaml \
    --s3-bucket REPLACE_THIS_WITH_YOUR_S3_BUCKET_NAME
Next, the following command will create a Cloudformation Stack and deploy your SAM resources.
sam deploy \
    --template-file packaged.yaml \
    --stack-name ec2-spot-interruption-dashboard \
    --capabilities CAPABILITY_IAM \
    --parameter-overrides \
        InstanceMetadataTableRetentionPeriodDays=30 \
        InstanceMetadataBucketRetentionPeriodDays=365 \
EnvironmentSize=small -
InstanceMetadataTableRetentionPeriodDays - Number of days to cache instance data in DynamoDB. Items will expire after this period elapses.
-
InstanceMetadataBucketRetentionPeriodDays - Number of days to retain instance data in S3. Items will expire after this period elapses.
-
EnvironmentSize - Corresponds to default settings for various environment sizes. These are general guidelines and it's possible these values need to be adjusted for your environment.
EnvironmentSizeMap:
    small:
        InstanceMetadataTableRCU: 5
        InstanceMetadataTableWCU: 10
        FunctionTimeout: 60
        FunctionMemorySize: 128
        FunctionRCE: 20
        StreamBatchSize: 10
        StreamMaximumBatchingWindowInSeconds: 10
        StreamMaximumRecordAgeInSeconds: 60
        StreamMaximumRetryAttempts: 5
        DataSinkStateMachineConcurrency: 1
    medium:
        InstanceMetadataTableRCU: 10
        InstanceMetadataTableWCU: 20
        FunctionTimeout: 60
        FunctionMemorySize: 128
        FunctionRCE: 50
        StreamBatchSize: 50
        StreamMaximumBatchingWindowInSeconds: 30
        StreamMaximumRecordAgeInSeconds: 90
        StreamMaximumRetryAttempts: 5
        DataSinkStateMachineConcurrency: 1
    large:
        InstanceMetadataTableRCU: 50
        InstanceMetadataTableWCU: 100
        FunctionTimeout: 180
        FunctionMemorySize: 128
        FunctionRCE: 100
        StreamBatchSize: 100
        StreamMaximumBatchingWindowInSeconds: 60
        StreamMaximumRecordAgeInSeconds: 120
        StreamMaximumRetryAttempts: 3
        DataSinkStateMachineConcurrency: 1
    extralarge:
        InstanceMetadataTableRCU: 100
        InstanceMetadataTableWCU: 200
        FunctionTimeout: 180
        FunctionMemorySize: 256
        FunctionRCE: 100
        StreamBatchSize: 200
        StreamMaximumBatchingWindowInSeconds: 120
        StreamMaximumRecordAgeInSeconds: 180
        StreamMaximumRetryAttempts: 5
        DataSinkStateMachineConcurrency: 1


