cLoki is a flexible Loki & Tempo compatible LogQL API built on top of ClickHouse
Natively supports Grafana and any LogQL clients for querying, processing, ingesting, tracing and alerting
💡 Get started using the cLoki Wiki
![]() Join us! All Contributions are Welcome!
Join us! All Contributions are Welcome!
The Loki API and its Grafana native integration are brilliant, simple and appealing - but we just love ClickHouse.
cLoki implements the same API functionality as Loki, buffered by a fast bulking LRU sitting on top of ClickHouse tables and relying on its columnar search and insert performance alongside solid distribution and clustering capabilities for stored data. Just like Loki, cLoki does not parse or index incoming logs, but rather groups log streams using the same label system as Prometheus.
cLoki implements a broad range of LogQL Queries to provide transparent compatibility with the Loki API
The Grafana Loki datasource can be used to natively query logs and display extracted timeseries
🎉 No plugins needed
- Log Stream Selector
- Line Filter Expression
- Label Filter Expression
- Parser Expression
- Log Range Aggregations
- Aggregation operators
- Unwrap Expression.
- Line Format Expression
🔥 Follow our examples to get started
cLoki supports input via Push API using JSON or Protobuf and it is compatible with Promtail and any other Loki compatible agent
Our preferred companion for parsing and shipping log streams to cLoki is paStash with extensive interpolation capabilities to create tags and trim any log fat. Sending JSON formatted logs is suggested when dealing with metrics.
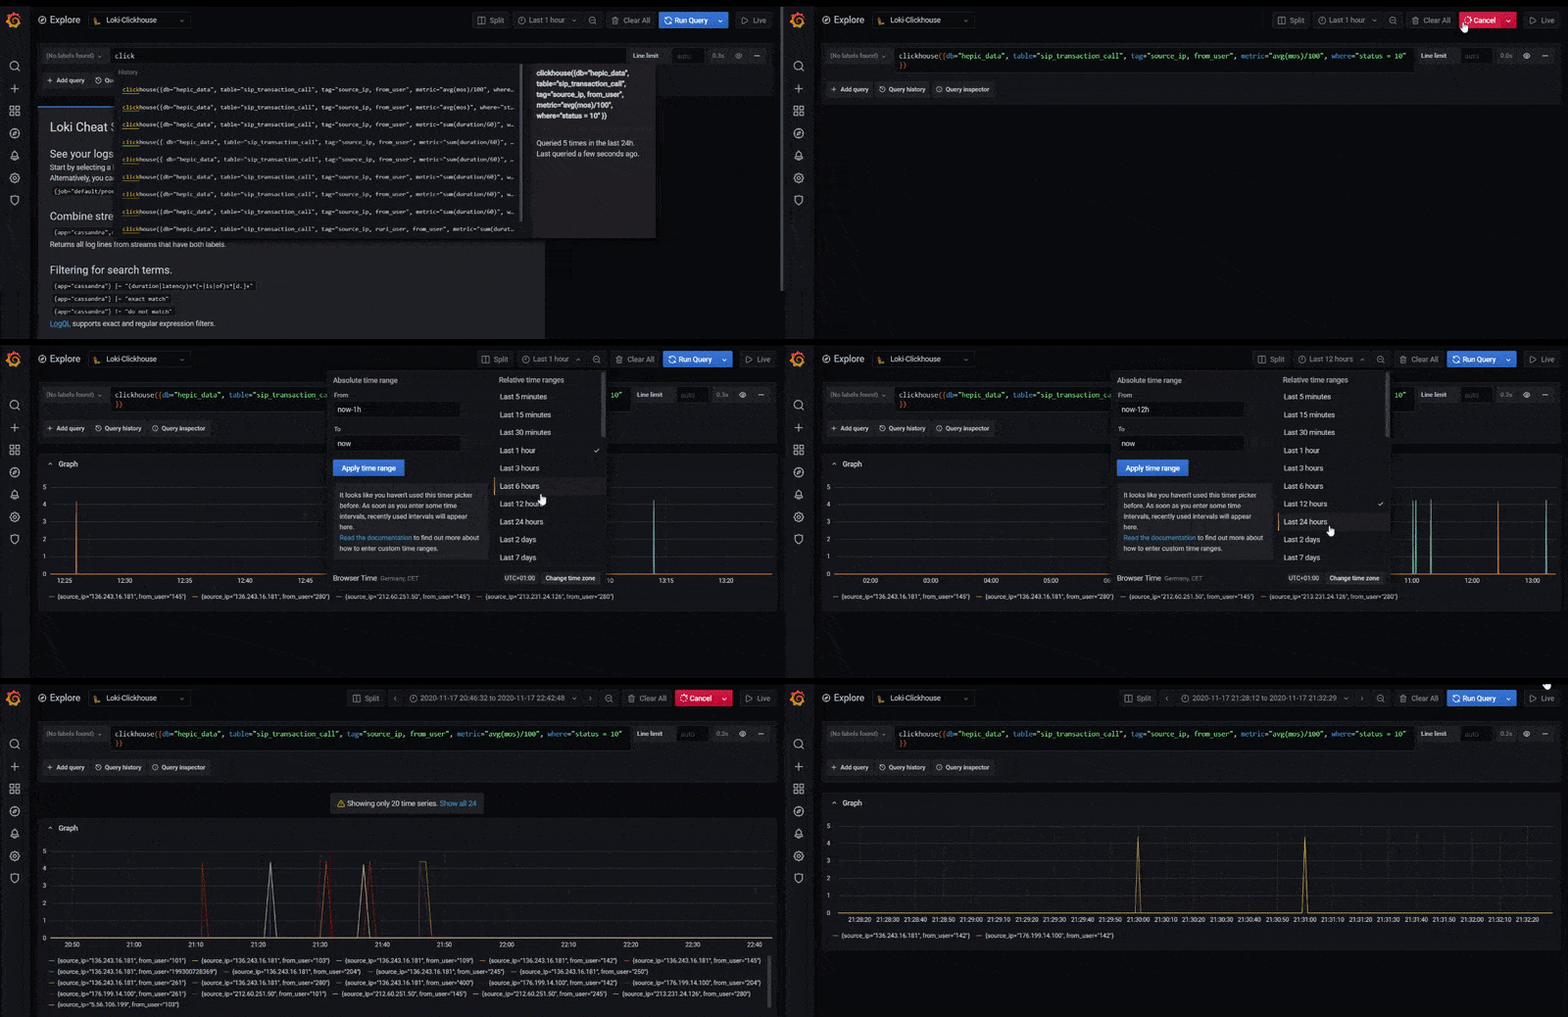
cLoki implements custom query functions for ClickHouse timeseries extraction, allowing direct access to any existing table
Convert columns to tagged timeseries using the emulated loki 2.0 query format
<aggr-op> by (<labels,>) (<function>(<metric>[range_in_seconds])) from <database>.<table> where <optional condition>
avg by (source_ip) (rate(mos[60])) from my_database.my_table
sum by (ruri_user, from_user) (rate(duration[300])) from my_database.my_table where duration > 10
Convert columns to tagged timeseries using the experimental clickhouse function
clickhouse({
  db="my_database",
  table="my_table",
  tag="source_ip",
  metric="avg(mos)",
  where="mos > 0",
  interval="60"
})
| parameter | description |
|---|---|
| db | clickhouse database name |
| table | clickhouse table name |
| tag | column(s) for tags, comma separated |
| metric | function for metric values |
| where | where condition (optional) |
| interval | interval in seconds (optional) |
| timefield | time/date field name (optional) |
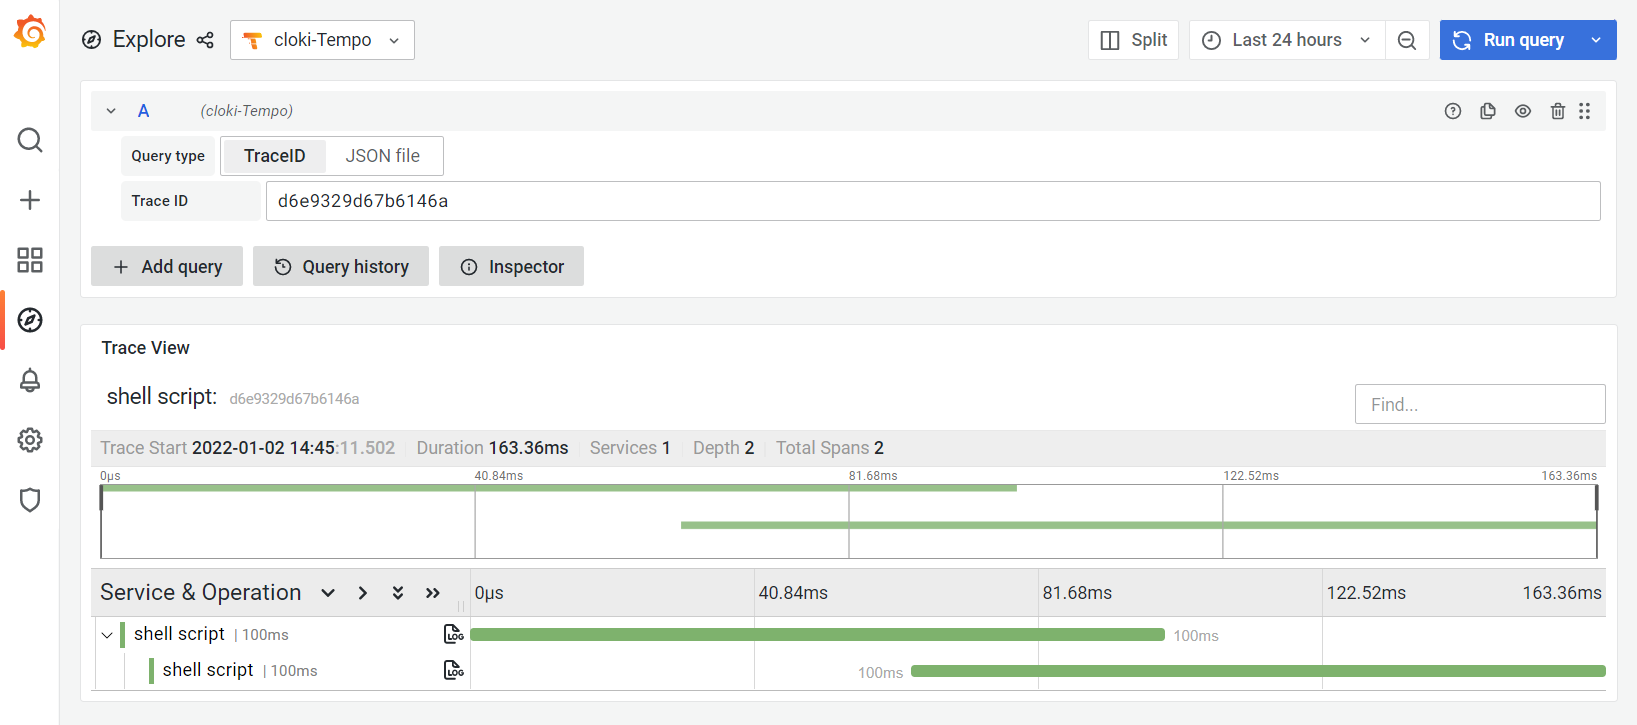
cLoki Pulse offers experimental support for the Grafana Tempo API providing span ingestion and querying
At database level, Tempo Spans/Traces are stored as tagged Logs and are accessible from both LogQL and Tempo APIs
Check out the Wiki for detailed instructions or choose a quick method:
Clone this repository, install with npmand run using nodejs 14.x (or higher)
npm install
CLICKHOUSE_SERVER="my.clickhouse.server" CLICKHOUSE_AUTH="default:password" CLICKHOUSE_DB="cloki" node cloki.jsInstall cloki as global package on your system using npm
sudo npm install -g cloki
cd $(dirname $(readlink -f `which cloki`)) \
&& CLICKHOUSE_SERVER="my.clickhouse.server" CLICKHOUSE_AUTH="default:password" CLICKHOUSE_DB="cloki" clokisudo npm install -g cloki pm2
cd $(dirname $(readlink -f `which cloki`)) \
&& CLICKHOUSE_SERVER="my.clickhouse.server" CLICKHOUSE_AUTH="default:password" CLICKHOUSE_DB="cloki" pm2 start cloki
pm2 save
pm2 startupFor a fully working demo, check the docker-compose example
The project uses pino for logging and by default outputs JSON'ified log lines. If you want to see "pretty" log lines you can start cloki with npm run pretty
The following ENV Variables can be used to control cLoki parameters and backend settings.
| ENV | Default | Usage |
|---|---|---|
| CLICKHOUSE_SERVER | localhost | Clickhouse Server address |
| CLICKHOUSE_PORT | 8123 | Clickhouse Server port |
| CLICKHOUSE_DB | cloki | Clickhouse Database Name |
| CLICKHOUSE_AUTH | default: | Clickhouse Authentication (user:password) |
| CLICKHOUSE_PROTO | http | Clickhouse Protocol (http, https) |
| CLICKHOUSE_TIMEFIELD | record_datetime | Clickhouse DateTime column for native queries |
| BULK_MAXAGE | 2000 | Max Age for Bulk Inserts |
| BULK_MAXSIZE | 5000 | Max Size for Bulk Inserts |
| BULK_MAXCACHE | 50000 | Max Labels in Memory Cache |
| LABELS_DAYS | 7 | Max Days before Label rotation |
| SAMPLES_DAYS | 7 | Max Days before Timeseries rotation |
| HOST | 0.0.0.0 | cLOKi API IP |
| PORT | 3100 | cLOKi API PORT |
| CLOKI_LOGIN | undefined | Basic HTTP Username |
| CLOKI_PASSWORD | undefined | Basic HTTP Password |
| READONLY | false | Readonly Mode, no DB Init |
| FASTIFY_BODYLIMIT | 5242880 | API Maximum payload size in bytes |
| FASTIFY_REQUESTTIMEOUT | 0 | API Maximum Request Timeout in ms |
| FASTIFY_MAXREQUESTS | 0 | API Maximum Requests per socket |
| TEMPO_SPAN | 24 | Default span for Tempo queries in hours |
| TEMPO_TAGTRACE | false | Optional tagging of TraceID (expensive) |
| DEBUG | false | Debug Mode (for backwards compatibility) |
| LOG_LEVEL | info | Log Level |
| HASH | short-hash | Hash function using for fingerprints. Currently supported short-hash and xxhash64 (xxhash64 function) |
Consult the Wiki for a detailed list of supported features, changelog and API functionality
cLoki is not affiliated or endorsed by Grafana Labs. All rights belong to their respective owners.


