Subway Ridership during COVID-19
A simple tool to download and view subway ridership data for New York City's MTA and Bay Area's BART.
Created by Youyang Gu.
For a time series CSV file of ridership per day or a list of busiest stations, see the output_data folder.
Source
BART - Daily Station Exits (updated monthly): https://www.bart.gov/about/reports/ridership
MTA - Turnstile Data (updated weekly): http://web.mta.info/developers/turnstile.html
Dependencies
You need Python 3.7+ with the following packages: numpy, pandas, requests, matplotlib (for plotting), openpyxl (to read Excel file)
You can quickly install all the dependencies by running the following:
pip install -r requirements.txt
Usage
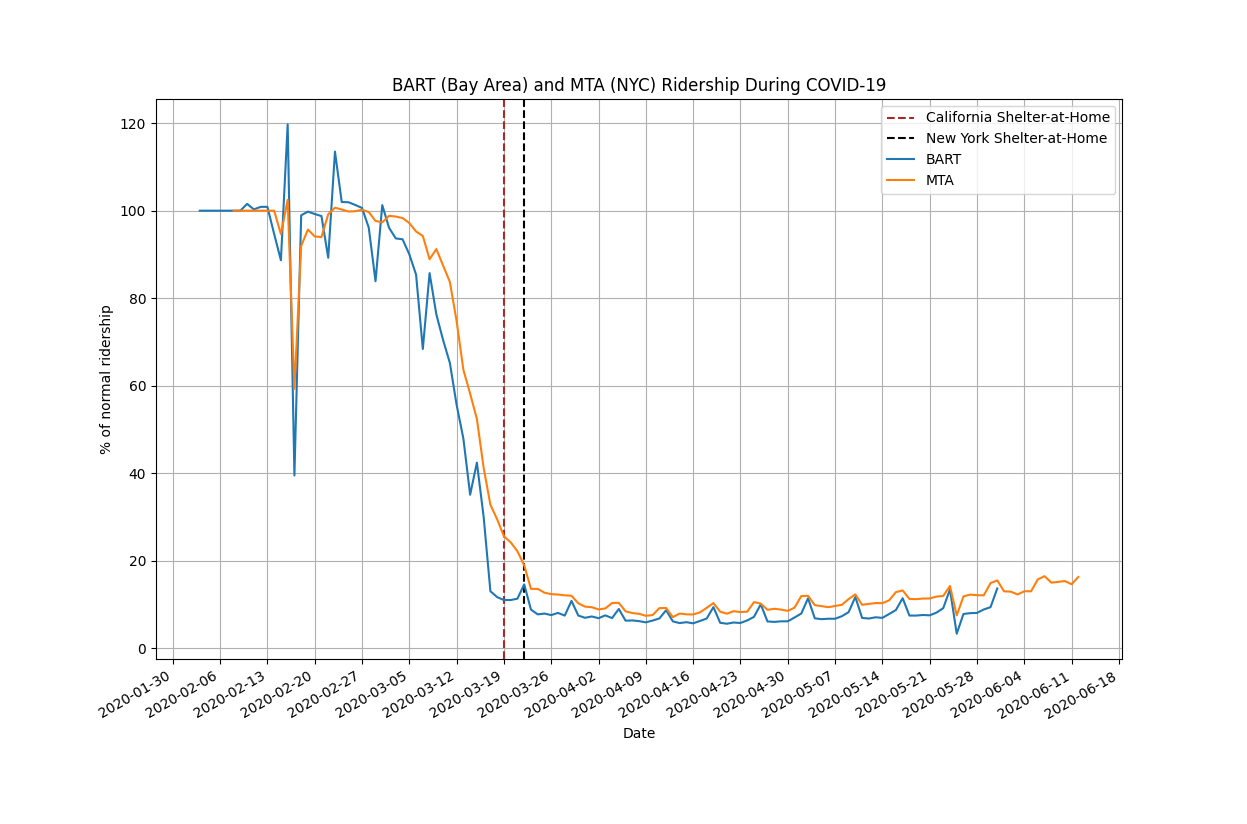
Plot BART + MTA ridership
python plot_ridership.py
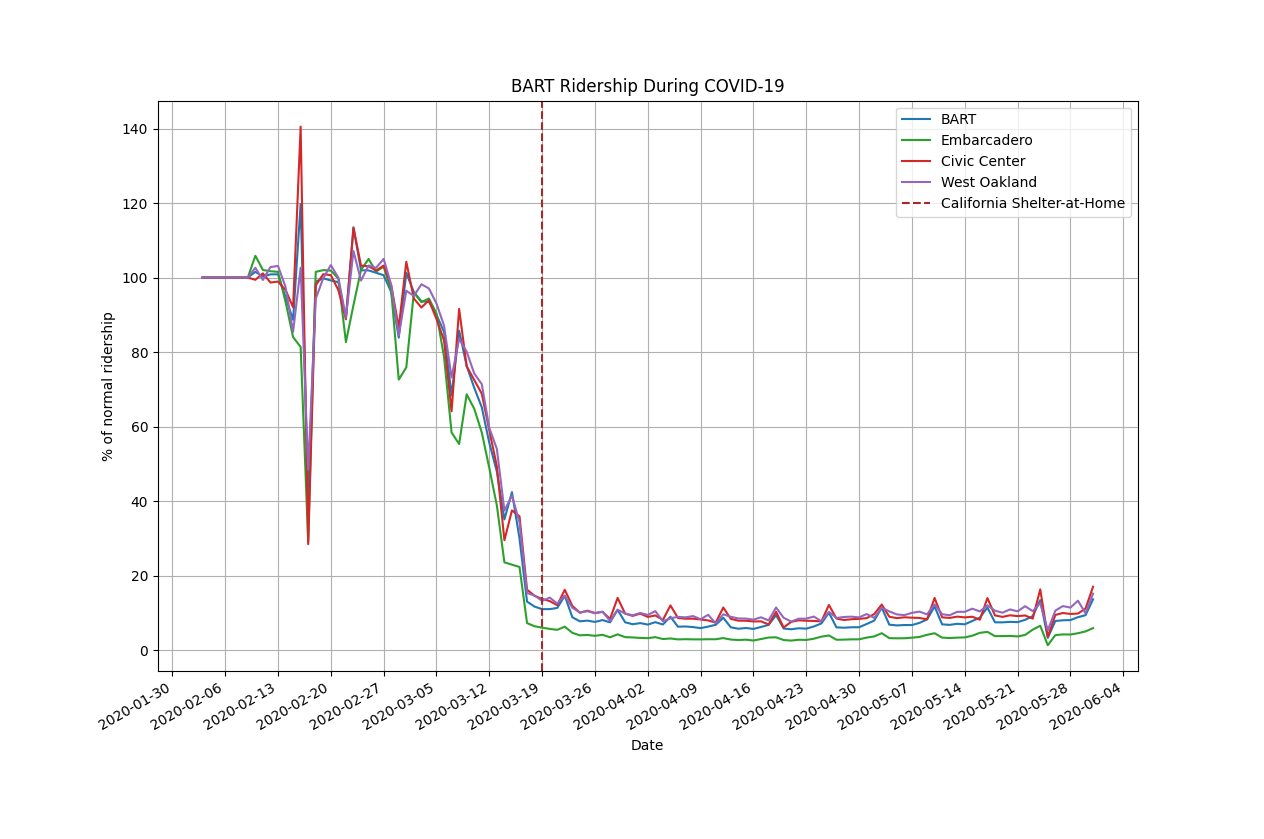
Plot BART ridership only
python bart_ridership.py
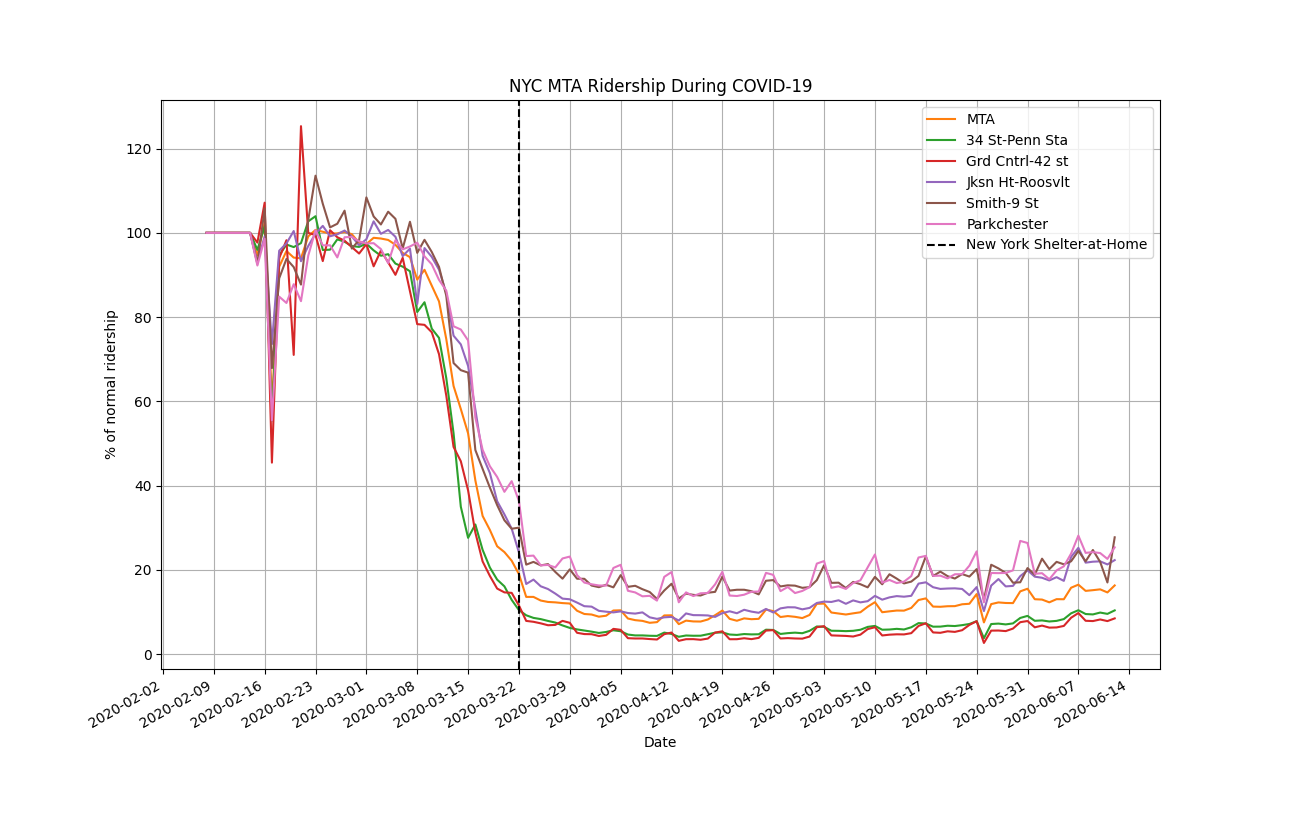
Plot MTA ridership only
python mta_ridership.py
Plot BART ridership + select stations
python bart_ridership.py --station_abbr EM --station_abbr CC --station_abbr OW
Station abbreviations here: https://github.com/youyanggu/subway_ridership/blob/master/output_data/busiest_stations_bart.csv
Plot MTA ridership + select stations
python mta_ridership.py --station_name 34 St-Penn Sta --station_name Grd Cntrl-42 st --station_name Jksn Ht-Roosvlt --station_name Smith-9 St --station_name Parkchester
Station names here: https://github.com/youyanggu/subway_ridership/blob/master/output_data/busiest_stations_mta.csv
Change baseline date
By default, we use the week of February 1 as the baseline to compare future ridership. To use a different start date, pass in a --start_date flag. You can also pass in an --end_date flag (default end date is the latest day):
python bart_ridership.py --start_date 2020-02-01 --end_date 2020-12-31
Save output
You can save the output of our ridership data by passing in the --out_fname flag. This will generate the file you see here: https://github.com/youyanggu/subway_ridership/blob/master/output_data/daily_bart_ridership.csv.
python bart_ridership.py --out_fname output_data/daily_bart_ridership.csv


