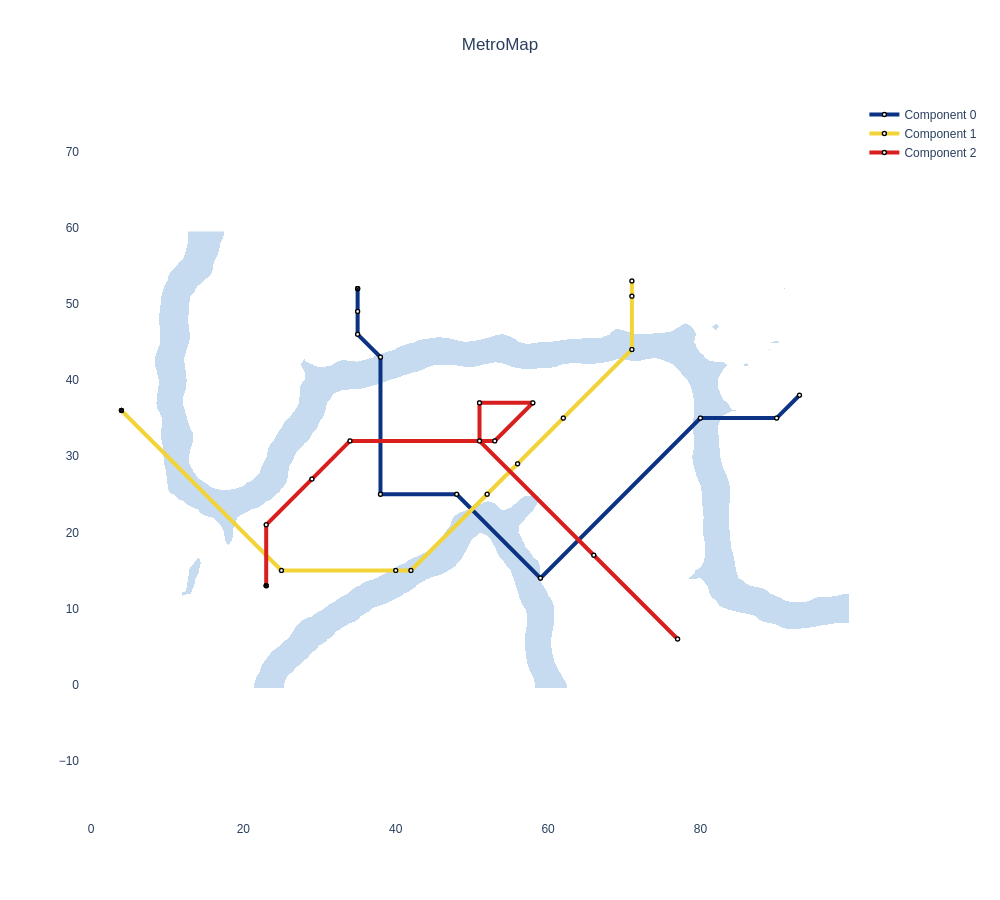
This repository provides a working implementation of the MetroMap visualization technique for self-organizing maps. It supports the visualization of SOMs trained with the Java SOMToolbox or minisom. The MetroMap solver implements a branch-and-bound-like algorithm. The algorithm only considers points that comply with the octilinearity constraints in its search space. Based on these points a number of possible solutions are generated of which the one with the lowest deviation from the original layout and the least 'sharp' bends is selected. By default the U-Matrix will be used as a background to the metro lines.
The original implementation of the notebook, which already contained functionality for reading files generated by the SOMToolbox, as well as the base implementation of the plotting utilities (UMatrix, hit histogram and SDH) were provided to us in the course of the Self-Organizing-Systems class at the TU Wien in the winter term 2020.
First clone the repository and install the packages required to run the notebook:
git clone https://github.com/yozoon/SOM-MetroMap.git
cd SOM-MetroMap/
pip install -r requirements.txt
After that the widgetsnbextension as well as the plotlywidget jupyter notebook extension have to be enabled. This step is required for properly displaying the plotly FigureWidget (without those steps the widgets won't be displayed at all)
jupyter nbextension enable --py widgetsnbextension
jupyter nbextension enable --py plotlywidgetThe following image shows the MetroMap that was generated by our implementation. The SOM was trained on the chainlink dataset using the SOMToolbox.
