Newspapers and online news aggregators like Google News need to understand which news articles will be the most popular, so that they can prioritize the order in which stories appear. In this repository, I tried to predict the popularity of a set of New York Times blog articles from the time period September 2014-December 2014.
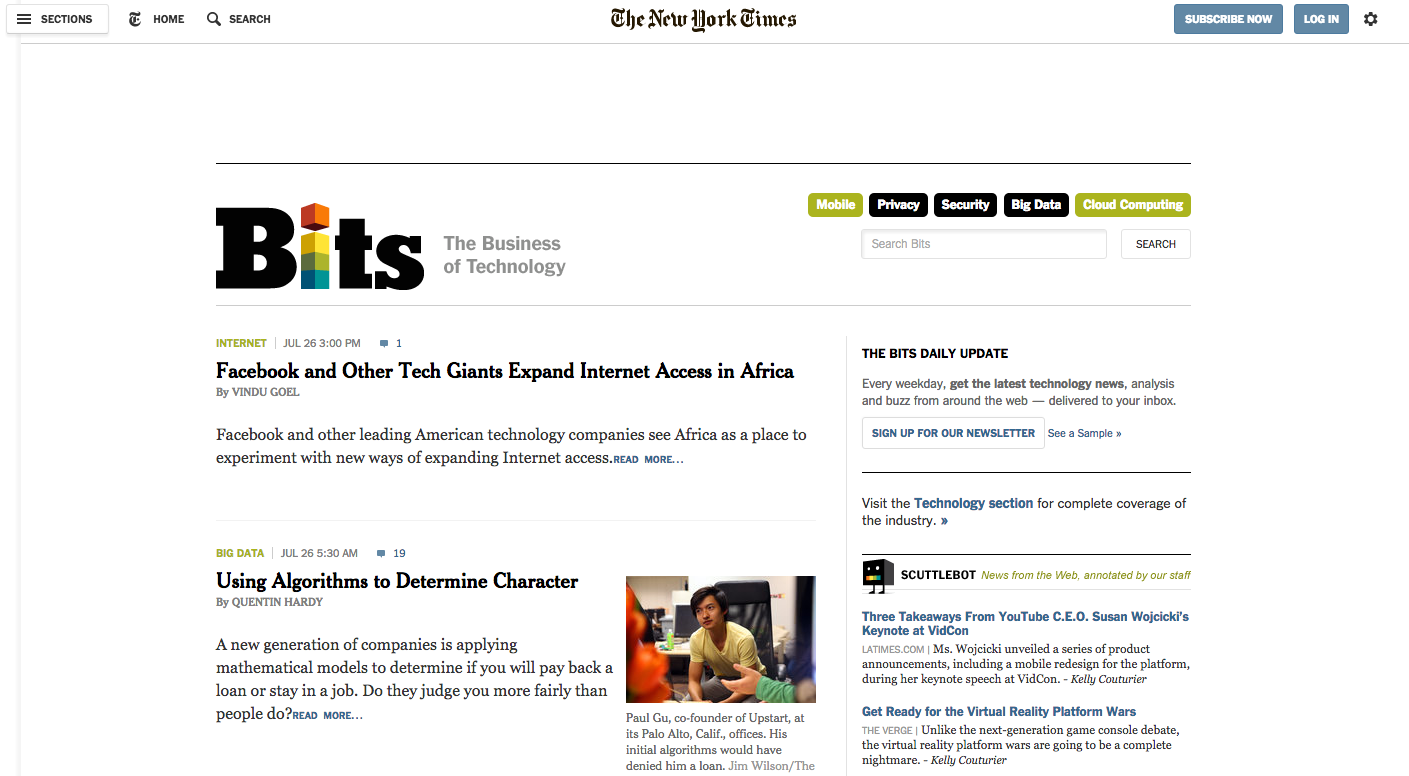
The following screenshot shows an example of the New York Times technology blog "Bits" homepage:

Many blog articles are published each day, and the New York Times has to decide which articles should be featured. I tried to answer that what features of a blog post make it popular.
| File Name | Description | Avaliable Formats |
|---|---|---|
| NYTimesBlogTest | 6532 articles | NYTimesBlogTest |
| NYTimesBlogTrain | 1870 articles | NYTimesBlogTrain |
The dependent variable in this problem is the variable Popular, which labels if an article had 25 or more comments in its online comment section (equal to 1 if it did, and 0 if it did not). The dependent variable is provided in the training data set, but not the testing dataset.
The independent variables consist of 8 pieces of article data available at the time of publication, and a unique identifier:
NewsDesk, the New York Times desk that produced the story (Business, Culture, Foreign, etc.)SectionName, the section the article appeared in (Opinion, Arts, Technology, etc.)SubsectionName, the subsection the article appeared in (Education, Small Business, Room for Debate, etc.)Headline, the title of the articleSnippet, a small portion of the article textAbstract, a summary of the blog article, written by the New York TimesWordCount, the number of words in the articlePubDate, the publication date, in the format "Year-Month-Day Hour:Minute:Second"UniqueID, a unique identifier for each article
Please have a look at report and source code.