💗Thank you
Take GF3 for example.
Acquisition of calibration constants
The calibration constant is determined by using an angular reflector and an active scaler whose calibration field has known the radar cross-sectional area.
where:
P^I= I^2+Q^2 Corresponding to the power of active scaler or Angle reflector in SAR complex image, I and Q correspond to the real and imaginary parts of class 1A complex image respectively
The equivalent backscattering coefficient of Gaofen-3 satellite is as follows:
-
Resolution of 1m~10m, imaging edge is better than -19dB;
-
The resolution is 25m~500m, the imaging center is better than -25dB, and the imaging edge is better than -21dB.
Therefore, ignoring the impact of noise, the above equation can be simplified as:
Replace each parameter with a dB value, i.e
In the product metadata file, the field CalibrationConst corresponds to KdB.
The backscattering coefficient can be calculated according to the following relationship:
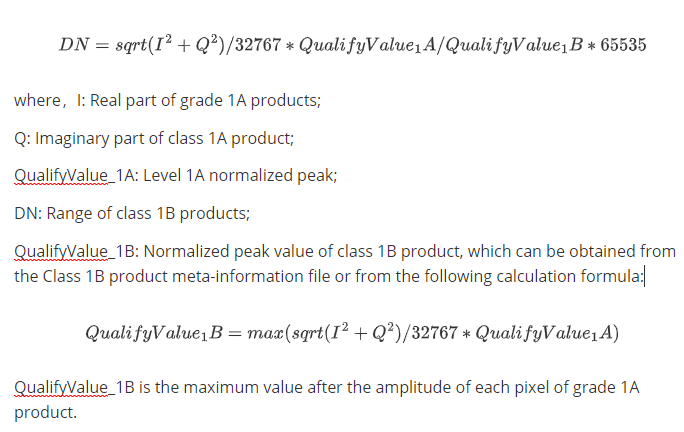
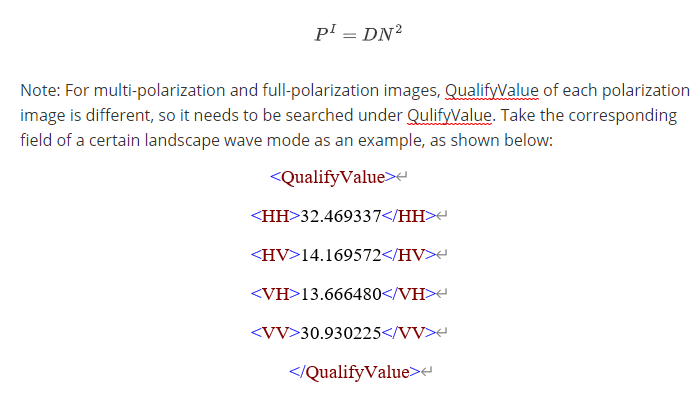
I is the real part of grade 1A product, Q is the virtual part of grade 1A product, QualifyValue is the maximum value of the scene image before quantization, which can be obtained through the metadata file field.
DN is the real part of grade 1A product, I is the virtual part of grade 1A product, QualifyValue is the maximum value of the scene image before quantization, which can be obtained through the metadata file field.
Orthophoto correction module using GDAL RPC
It mainly records the pauli decomposition of fully polarized synthetic aperture radar visualization (false color synthesis of SAR).
The Pauli decomposition uses the so-called Pauli basis to represent the measured scattering matrix [S]. If we consider the conventional orthogonal linear basis (h, v), under normal circumstances, the Pauli basis consists of four 2×2 matrices, and the specific formulas are not listed here. Please search for relevant papers on Google.
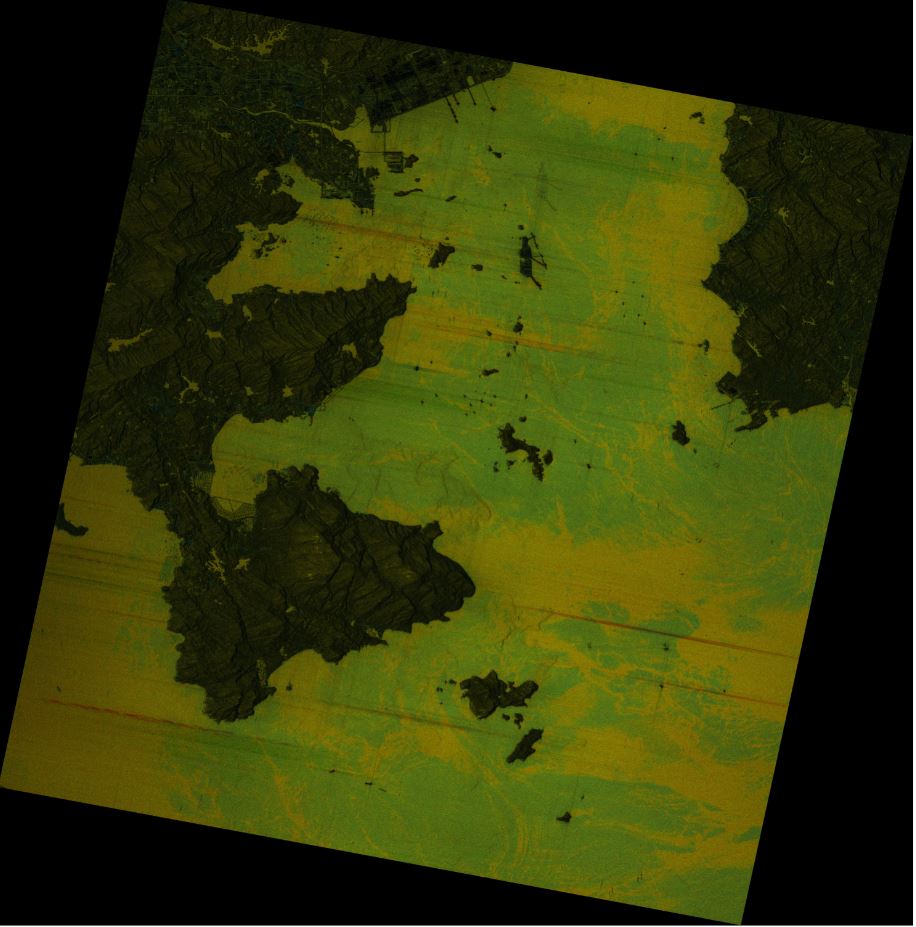
Take Gaofen No. 3 as an example, calculate its backscattering coefficient, geometrically correct it, and then perform pauli decomposition and false-color image synthesis.
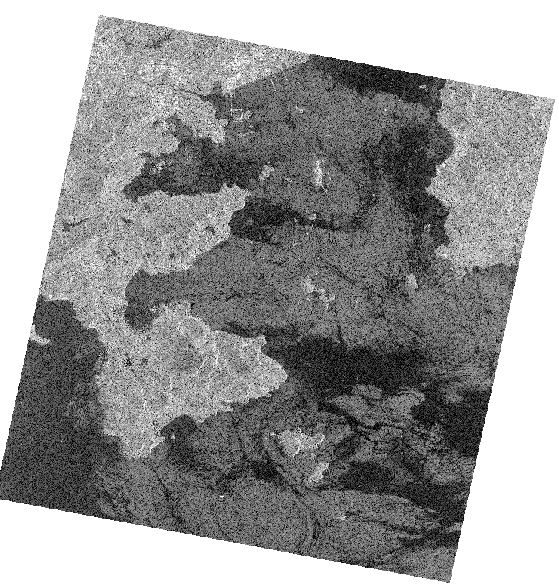
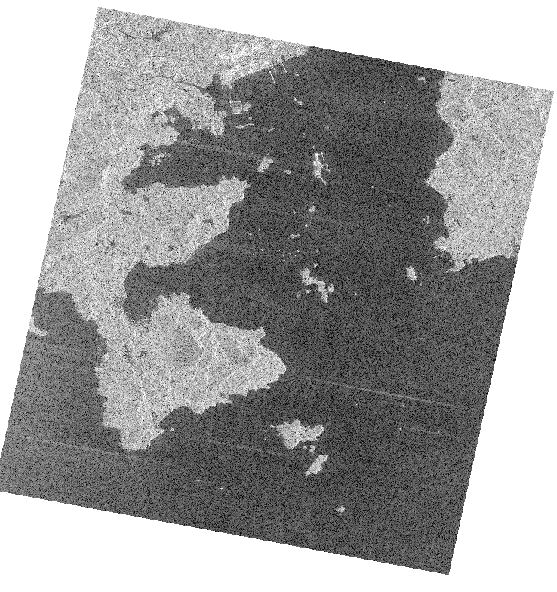
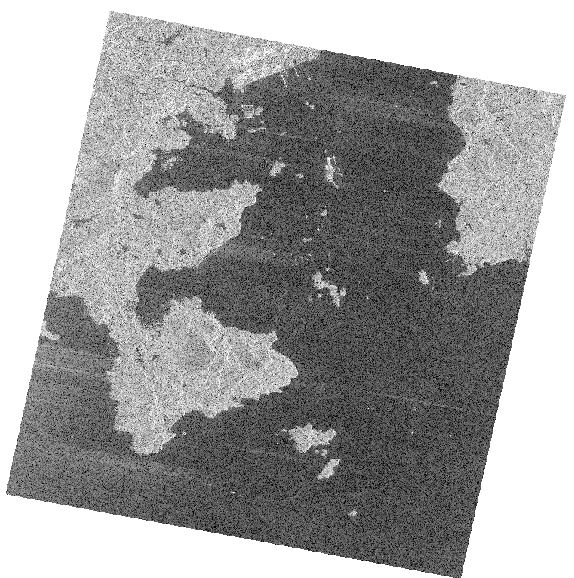
Use arcgis to open the backscatter coefficient calculation and geometric correction data, as follows.
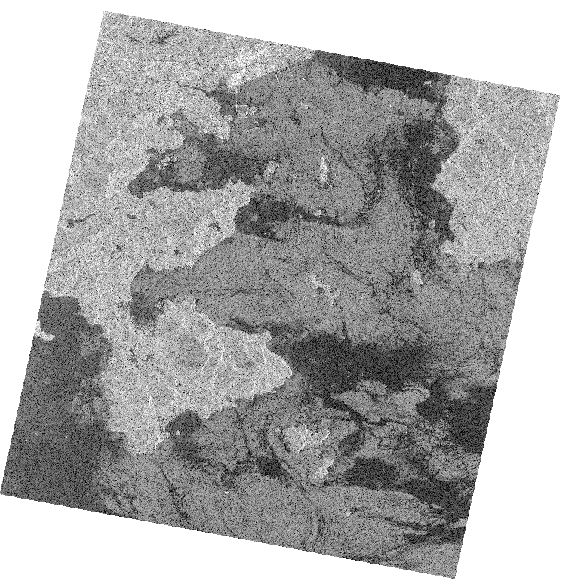
HH image
HV image
VH image
VV image
The data was decomposed by pauli, the data was resampled to 8bit, and then linearly stretched. The visualization results are as follows:
Pauli decomposition false color of synthetic aperture radar
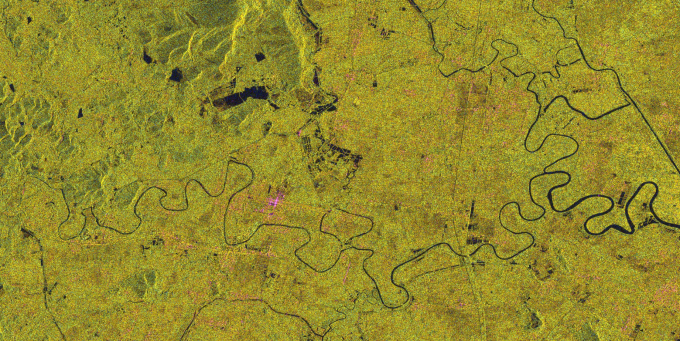
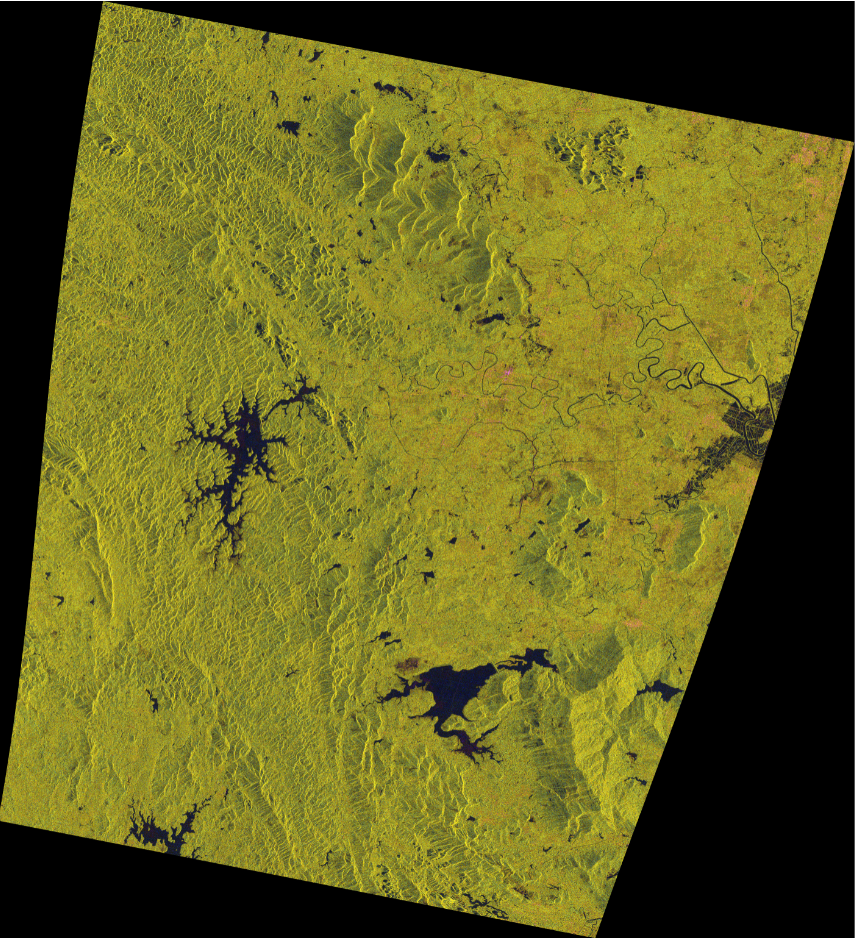
The other 2 scenes of sar image test are as follows:
The data is the image taken by the QPSI sensor of China Radar Image Gaofen-3.
Description of the data used: The images used have been calculated and geometrically corrected for backscattering coefficients.
The effect of pauli decomposition is good. The advantage is that the false-color synthesized image is more in line with the human visual perception, and it is easy to extract the coastline.


