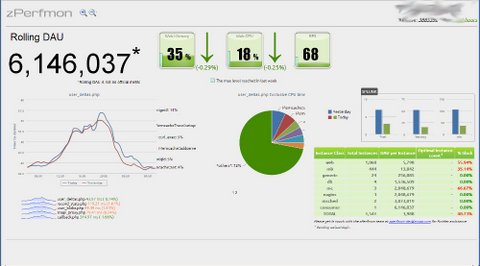
zPerfmon is an app performance analysis suite. It collects production profiles, systems metrics and other data on a periodic basis. It has data visualization and data correlation capabilities which lets you answer questions about performance, health and behavior trends as well.
Server - which takes care of ETL-ing, storing and presenting collected data. Data streams can consist of profiles, page hits, system metrics, unqiue user counts or even arbitrary events with timestamps.
Client - is like an agent. It goes into the application being monitored and at a minimum triggers profile collection. As long as the client generates PHP serialized or igbinary serialized xhprof formatted data, server can pick it up. There is a schema mandated for the profile name.
Server and Client are connected by a configuration file. The PHP client uses xhprof extension for profile collection. For another language or platform to deliver profiles into zPerfmon, you will need a profile generation solution in that language which can dump xhprof formatted profiles.
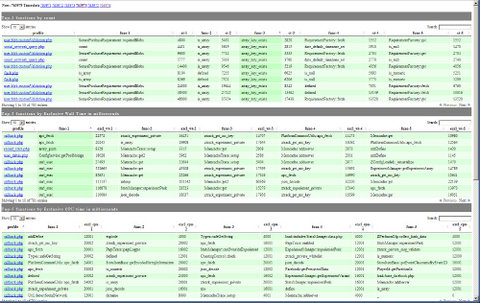
The most intersting view for a developer from a performance or behavior
perspective is the profile browser tab. It shows an average profile for each
distinct page hit at half hour granularity.
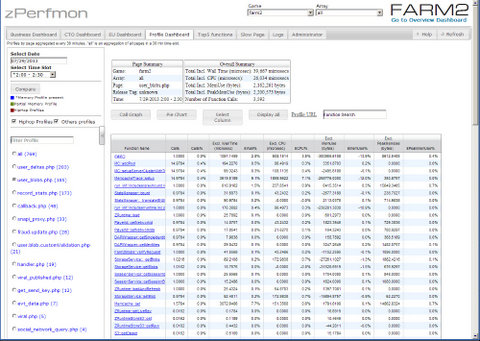
If however, you want to browse individual profiles, maybe to see the one errant hit which took 10 times the average, or look at the hit which consumed the most CPU, there is the un-aggregated view
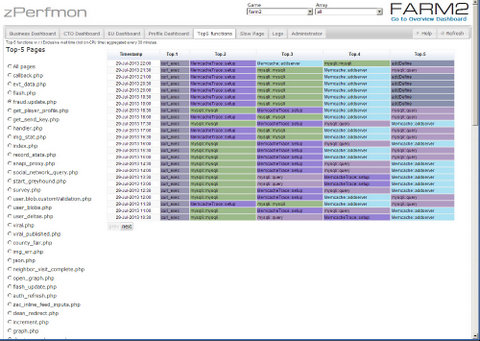
Data mined from profiles are surfaced in different ways. Top-5 functions is one of them. It provides visual clues when top function distribution according to wall time change.
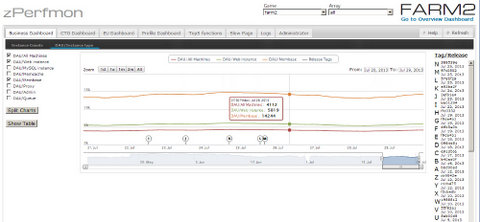
High altitude overviews which answer questions like "Did my web instance count go up without user count increasing?" is answered by the business tab
