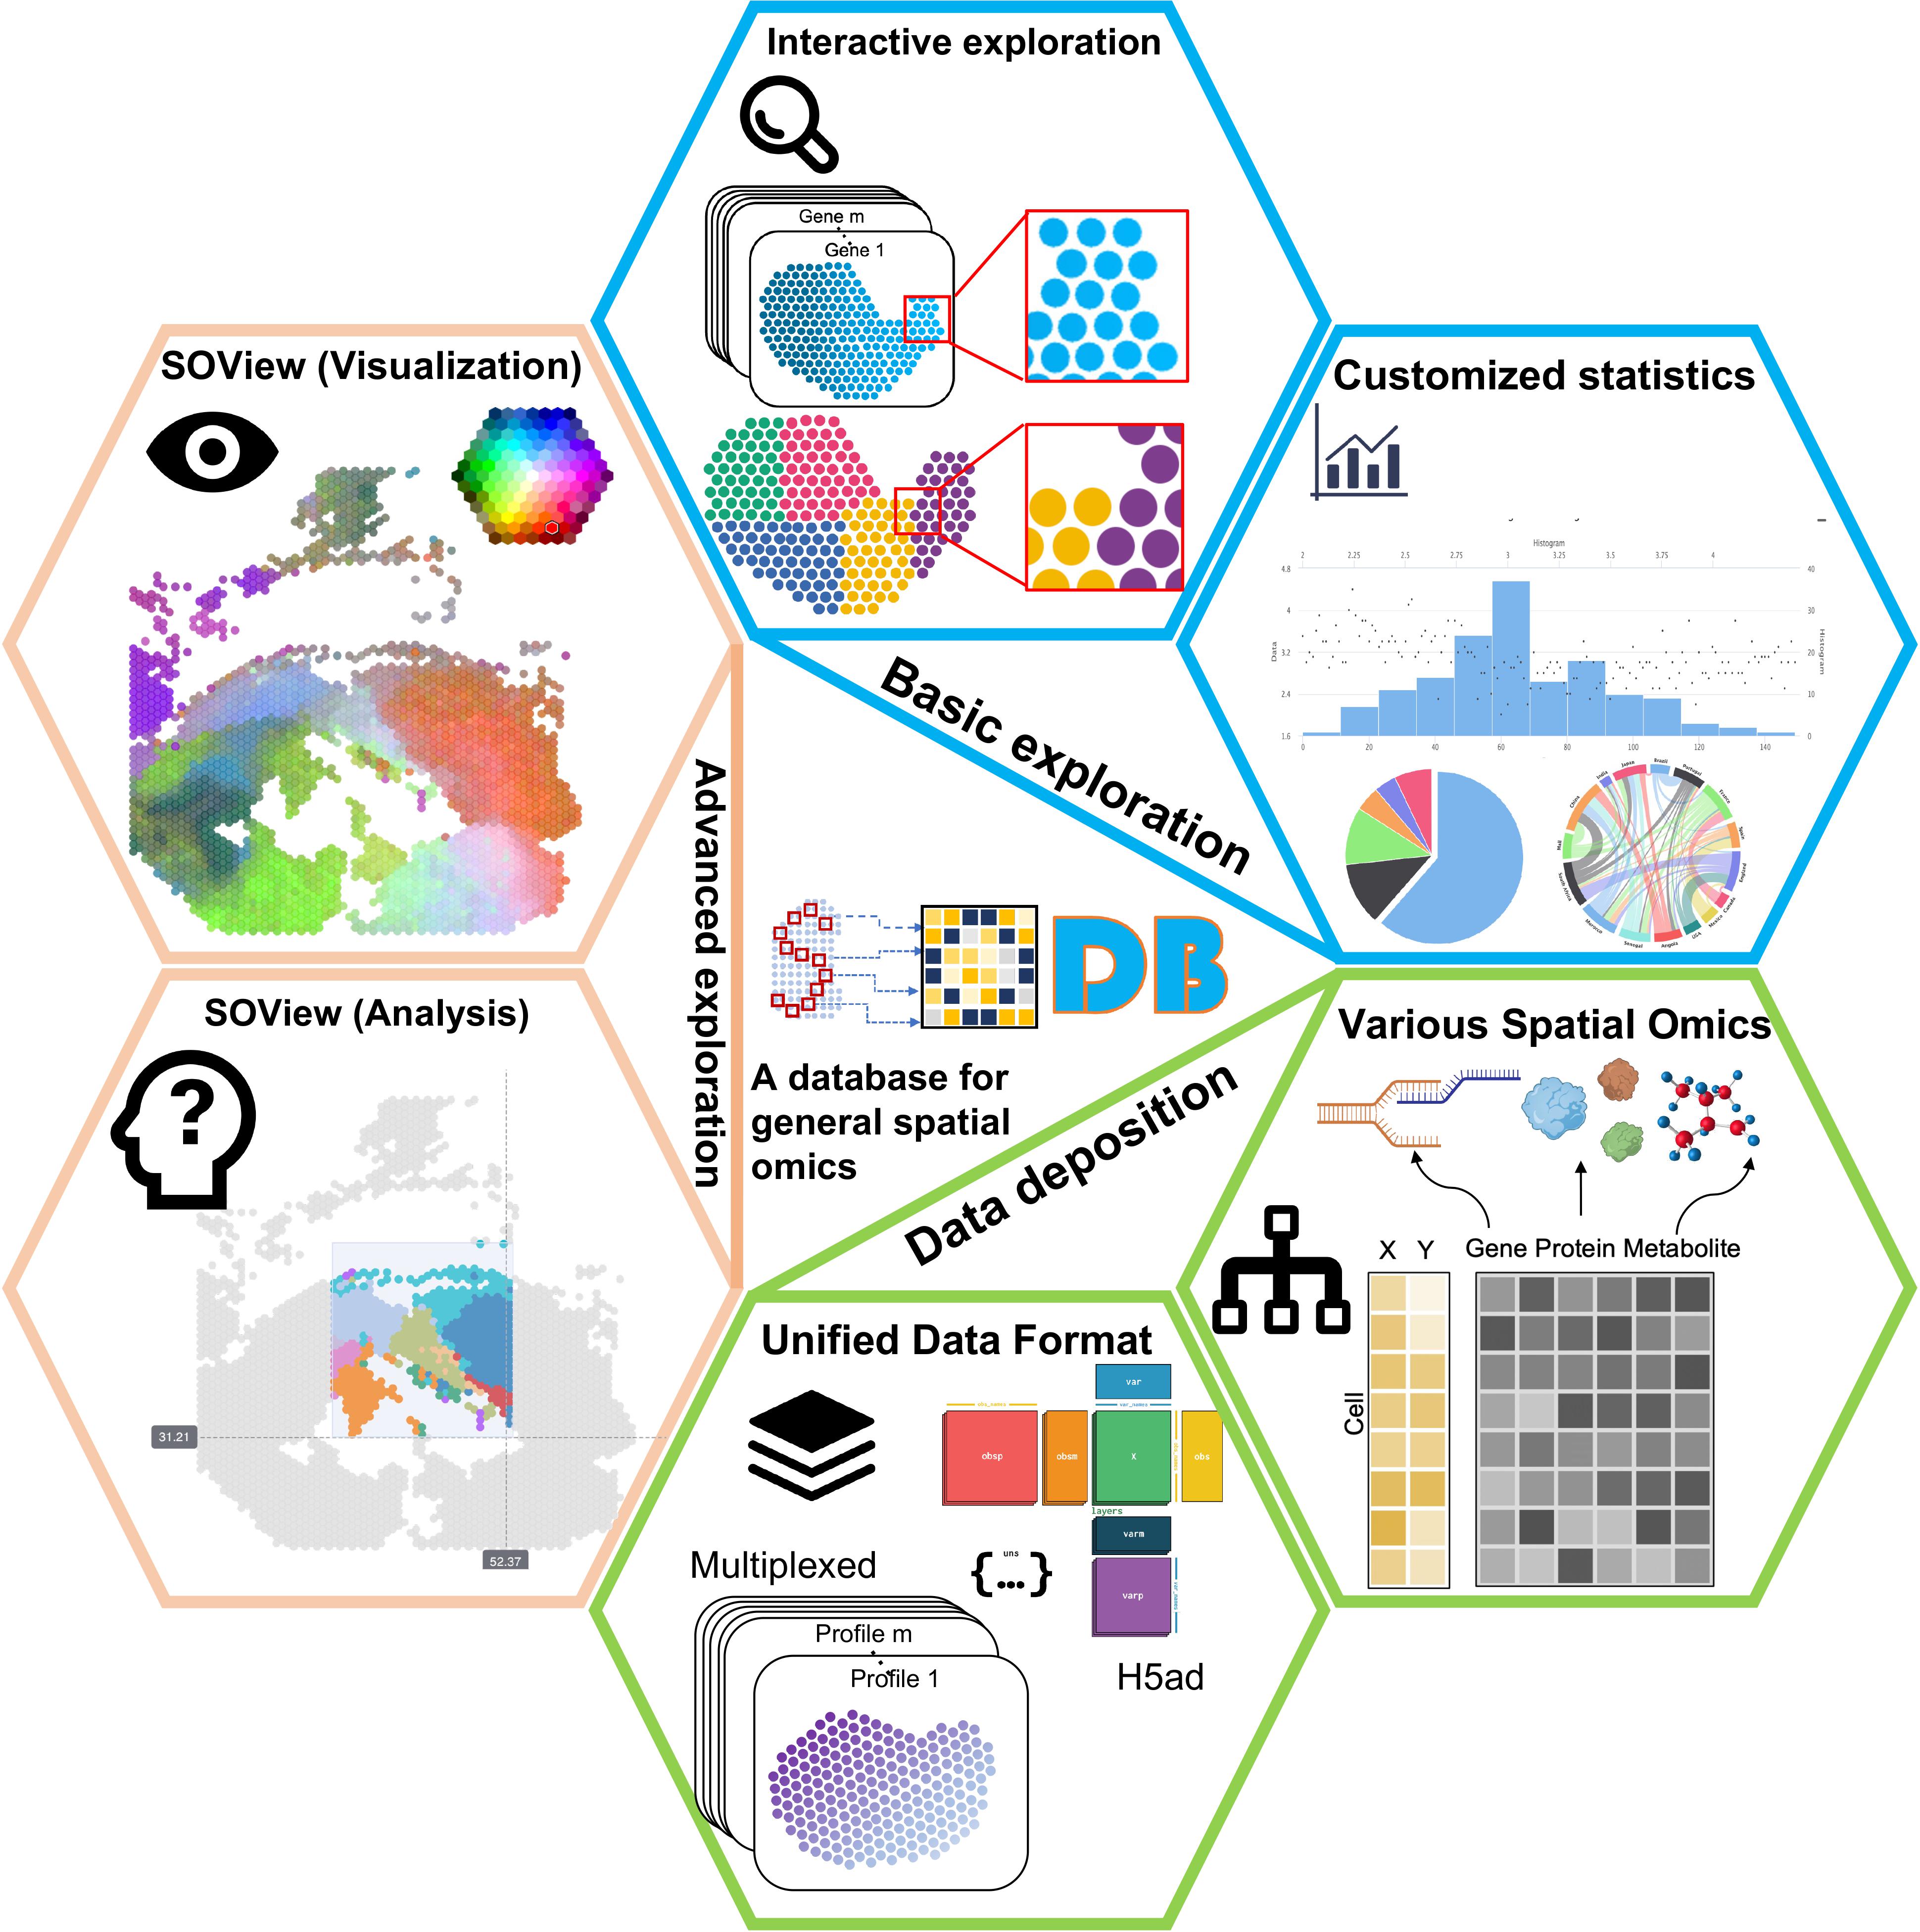
New: A command-line version of SOView is available at SOView
This repo contains code related to SODB and
its companion command-line package pysodb.
- Data Processing
- Figure Regeneration
- Benchmarking
- Demonstration
| Category | Purpose | Figure | Code |
|---|---|---|---|
| Website | Website of SODB | None | Link |
| Website | Website of pysodb | None | Link |
| Data Processing | Process Raw data to Anndata format | None | Link |
| Data Processing | Process Anndata format to SODB ready | None | Link |
| Figure Regeneration | Compare with related works | Fig. 1g | Link |
| Figure Regeneration | Timeline plot of spatial omics | Fig. 2a | Link |
| Figure Regeneration | Pie chart of category statistics of datasets | Fig. 2bcdgh | Link |
| Figure Regeneration | Tree plot of human and mouse studies | Fig. 2ef | Link |
| Figure Regeneration | Boxplot of SE features and data sparsity | Fig. 2ij | Link |
| Figure Regeneration | Other figures | Fig. 3~5 | Generated by SODB website |
| Figure Regeneration | Computational methods covered by review papers | Fig. 6a | Link |
| Figure Regeneration | Methods supported by SODB | Fig. 6bcd | Link |
| Figure Regeneration | Datasets frequency analysis | Fig. 6ef | Link |
| Figure Regeneration | 4i spatial proteomics analysis | Fig. S14 | Link |
| Figure Regeneration | Country distribution | Fig. S6 | Link |
| Benchmarking | Benchmark analysis of data loading | Fig. S24 | Link |
| Benchmarking | Benchmark analysis of spatial domain | Fig. S25~42 | Link |
| Demonstration | Tutorial of pysodb | None | Link |
| Demonstration | Demonstrate the compatibility with SCANPY and Squidpy | Fig. 1 | Link |
Yuan, Z., Pan, W., Zhao, X. et al. SODB facilitates comprehensive exploration of spatial omics data. Nat Methods (2023). https://doi.org/10.1038/s41592-023-01773-7
Spatial Omics DataBase (SODB): increasing accessibility to spatial omics data. Nat Methods (2023). https://doi.org/10.1038/s41592-023-01772-8
