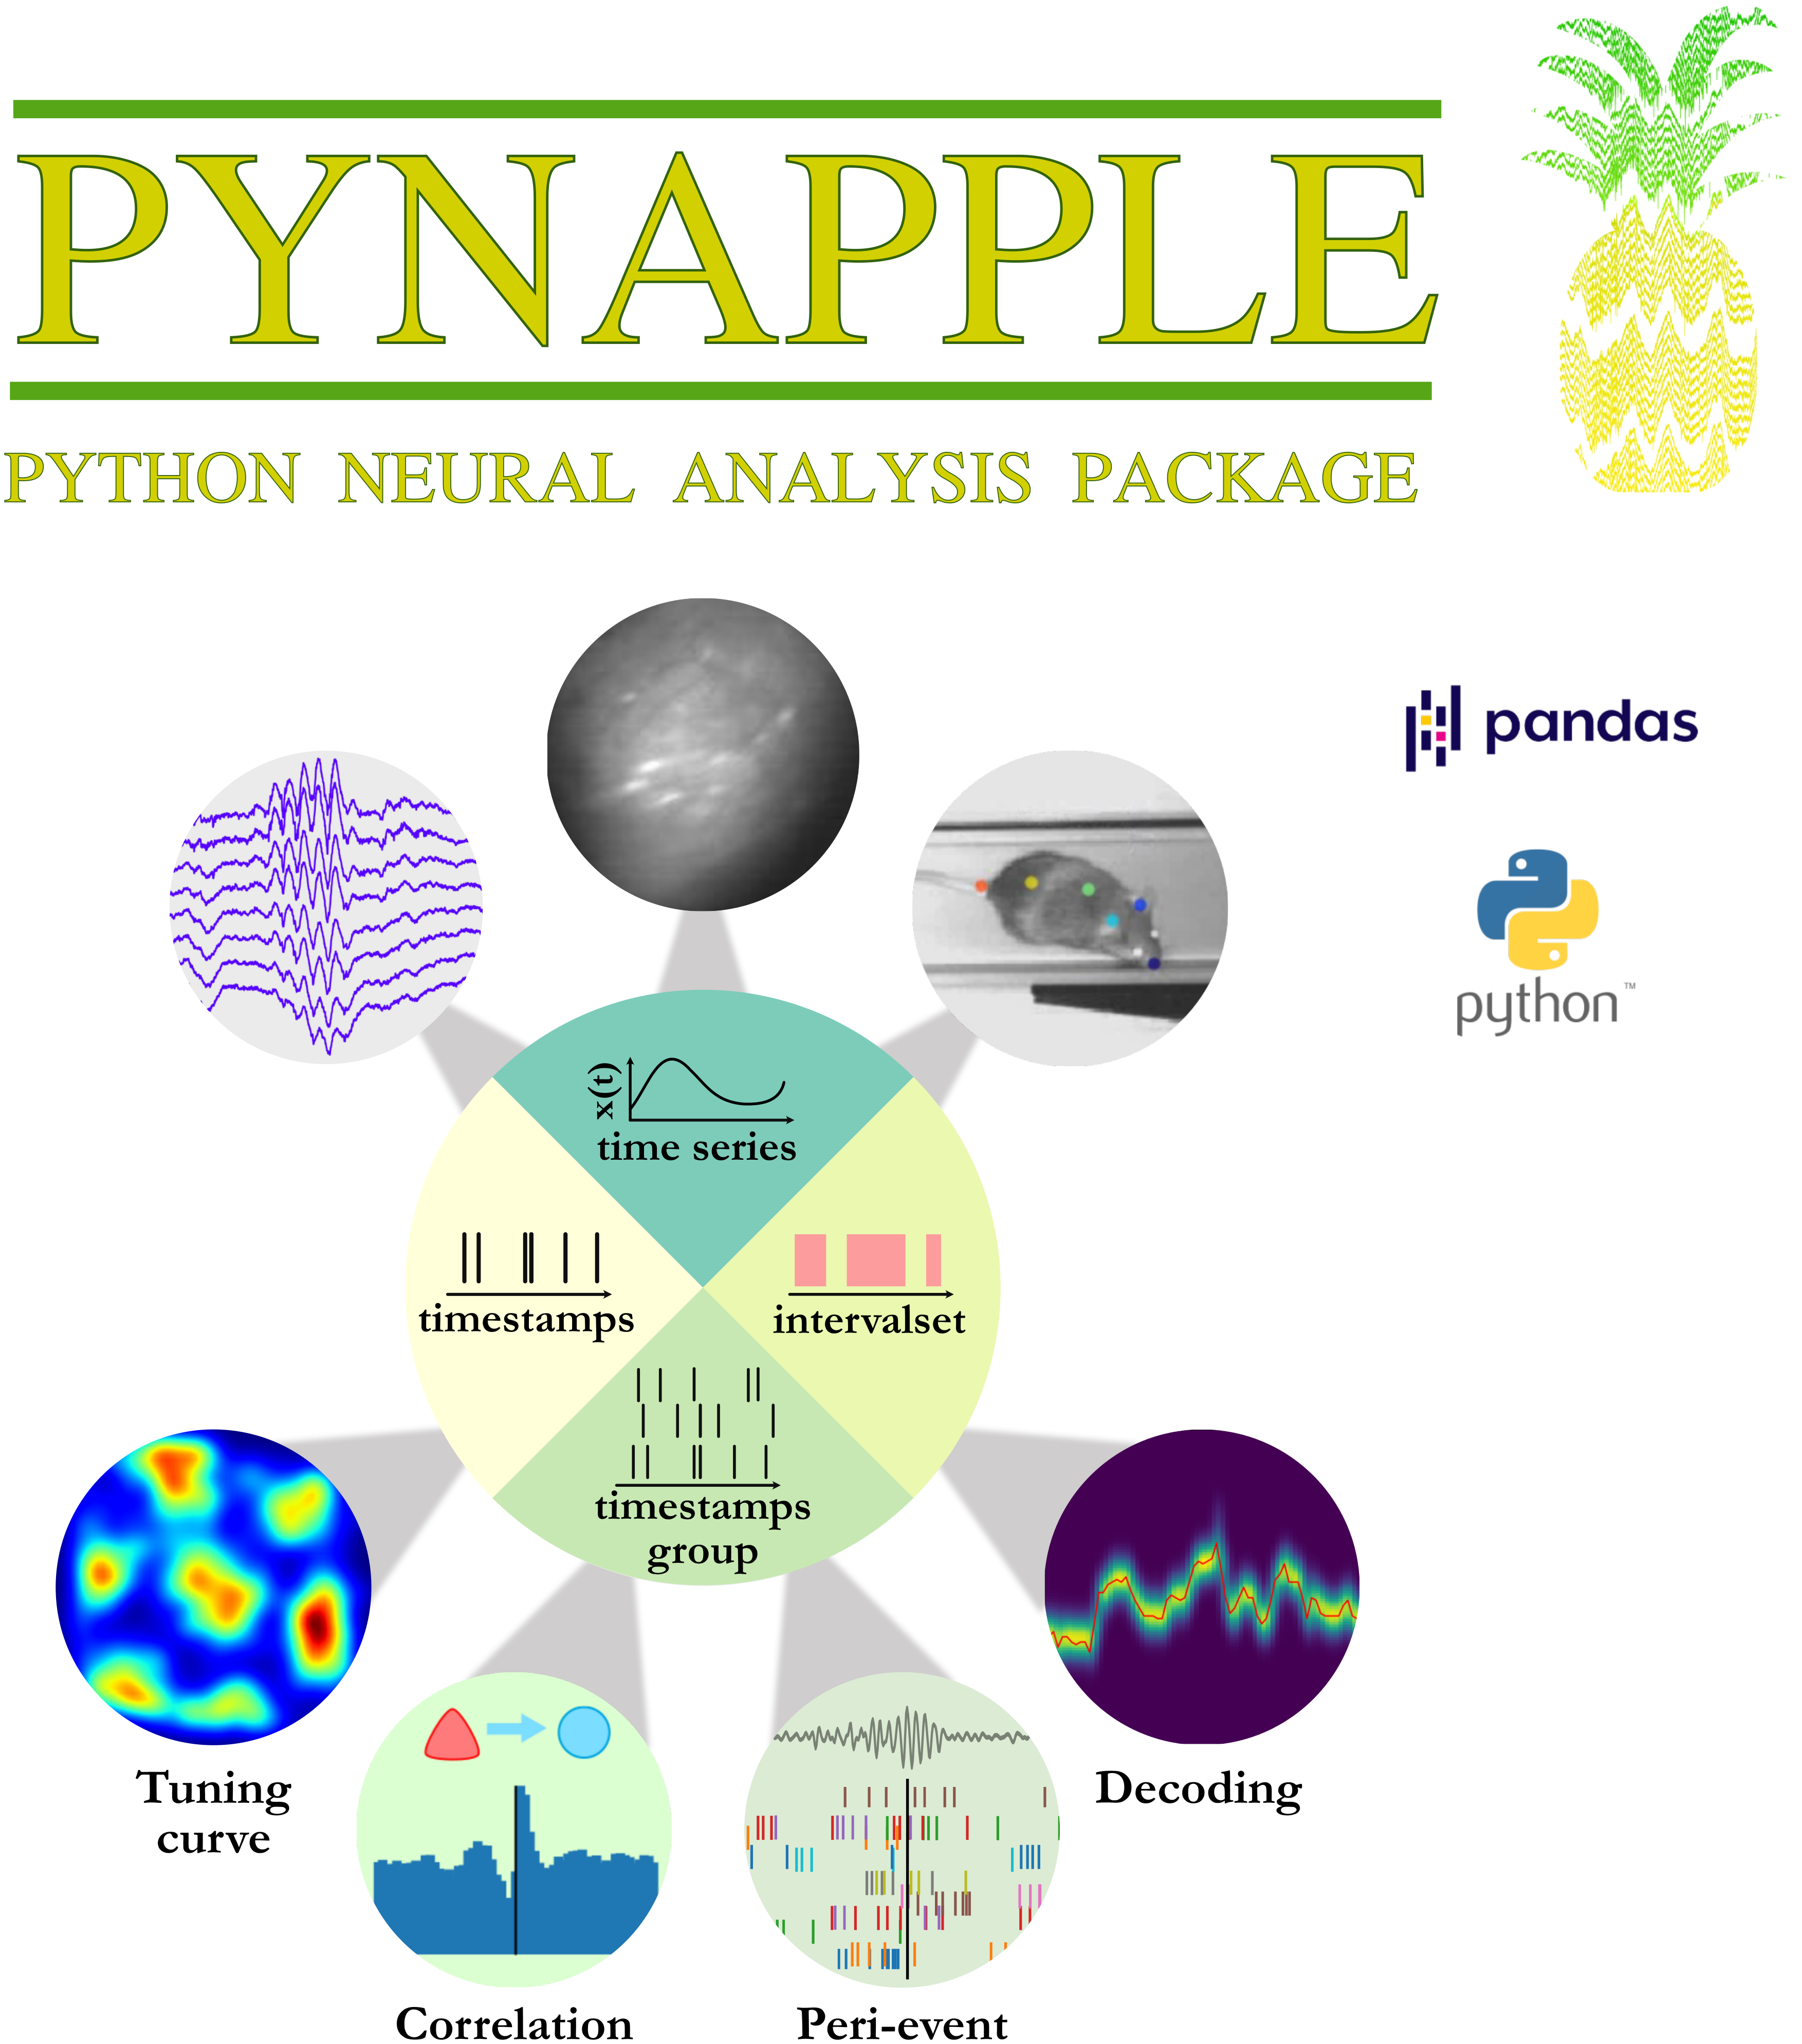
PYthon Neural Analysis Package.
pynapple is a light-weight python library for neurophysiological data analysis. The goal is to offer a versatile set of tools to study typical data in the field, i.e. time series (spike times, behavioral events, etc.) and time intervals (trials, brain states, etc.). It also provides users with generic functions for neuroscience such as tuning curves and cross-correlograms.
- Free software: GNU General Public License v3
- Documentation: https://peyrachelab.github.io/pynapple
- Notebooks and tutorials : https://peyrachelab.github.io/pynapple/notebooks/pynapple-quick-start/
- Collaborative repository: https://github.com/PeyracheLab/pynacollada
The best way to install pynapple is with pip within a new conda environment :
$ conda create --name pynapple pip
$ conda activate pynapple
$ pip install pynapple
or directly from the source code:
$ conda create --name pynapple pip
$ conda activate pynapple
$ # clone the repository
$ git clone https://github.com/PeyracheLab/pynapple.git
$ cd pynapple
$ # Install in editable mode with `-e` or, equivalently, `--editable`
$ pip install -e .
This procedure will install all the dependencies including
- pandas
- numpy
- scipy
- numba
- pynwb 2.0
- tabulate
- pyqt5
- pyqtgraph
- h5py
For spyder users, it is recommended to install spyder after installing pynapple with :
$ conda create --name pynapple pip
$ conda activate pynapple
$ pip install pynapple
$ pip install spyder
$ spyder
After installation, the package can imported:
$ python
>>> import pynapple as nap
An example of the package can be seen below. The exemple data can be found here. The folder already contains the NWB file (See this notebook for understanding the creation of the NWB file).
import numpy as np
import pandas as pd
import pynapple as nap
from matplotlib.pyplot import *

data_directory = '/your/path/to/A2929-200711'

# LOADING DATA
data = nap.load_session(data_directory, 'neurosuite')


spikes = data.spikes
position = data.position
wake_ep = data.epochs['wake']

# COMPUTING TUNING CURVES
tuning_curves = nap.compute_1d_tuning_curves(group = spikes,
                                            feature = position['ry'],
                                            ep = position['ry'].time_support,
                                            nb_bins = 120,
                                            minmax=(0, 2*np.pi) )


# PLOT
figure()
for i in spikes:
    subplot(6,7,i+1, projection = 'polar')
    plot(tuning_curves[i])


show()Special thanks to Francesco P. Battaglia (https://github.com/fpbattaglia) for the development of the original TSToolbox (https://github.com/PeyracheLab/TStoolbox) and neuroseries (https://github.com/NeuroNetMem/neuroseries) packages, the latter constituting the core of pynapple.
This package was developped by Guillaume Viejo (https://github.com/gviejo) and other members of the Peyrache Lab.
Logo: Sofia Skromne Carrasco, 2021.


