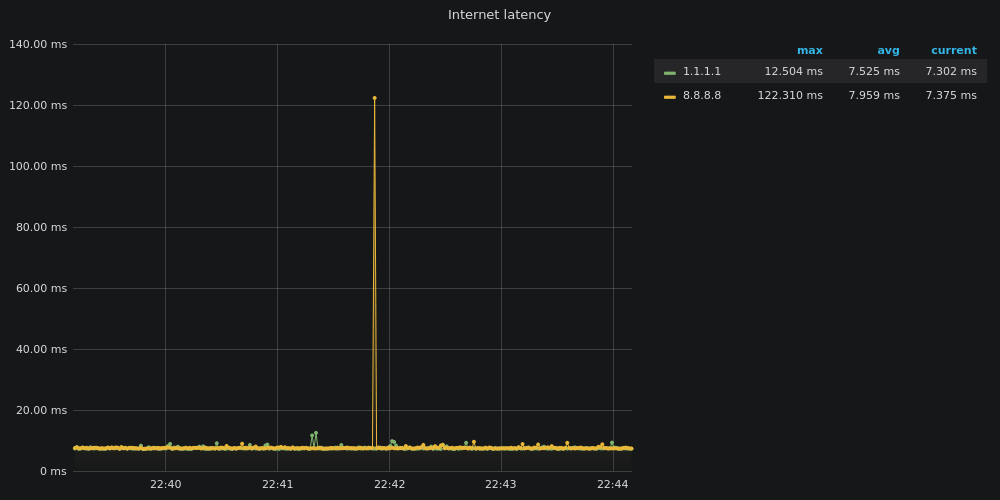
A simple Grafana dashboard to monitor the health and latency of your Internet connection.
You can deploy it on a server in your local network (a Raspberry Pi or a NAS for example) and use it to send screenshot to your ISP if your connection is not working properly.
Why not SmokePing ?
With Grafana you are able to explore network activity in custom time ranges, Grafana graphs are sexier and Covid-19 boredom is killing me.
Docker and Docker Compose
- change all the CHANGEME in docker-compose.yml for your needs
docker-compose up -d- visit http://localhost:3000 and login with username "admin" and the password provided in step 1.
- Dashboards > Manage > PING
- enjoy
