#Traffic Sign Recognition
##INTRODUCTION This is a Convolution Neural Network model used to classify images . in this repository , i had used this model to classify German Traffic sign boards into 42 classes . this model takes 32X32X3 image as input and predicts the sign board type using CNN and fully connected Neural Network
Build a Traffic Sign Recognition Project
The goals / steps of this project are the following: ( create a file named model on your working directory)
- import the needed libraries (Tensorflow , matplotlib ,sklearn ,random ,opencv ,numpy ,pickle)
- import the signnames.csv file to form a dictionary which maps the sign names to the class number provided in y_labels
- import the train , valid , test data from the pickle file
- summarize and visualize the input data
- convert BGR image to Gray scale
- create additional training data randomly by applying image transformation technique to the training data
- define function conv2d() and pooling() to make the process of creating convolution layers much easier
- create weights and biases needed for the convolutional layers and fully connected layers. use truncated_normal to generate random values
- for making the process of creating graph easier , define a function graph1() to create the graph
- create the placeholder names for the image data and labels
- define prediction , accuracy , optimizer , loss
- Run the model on the training data and save the session
- use testing data to find the accuracy of our model
- to make things interesting , search for traffic signals online and use these to check our model
- convert the new images to fit our model by applying resize
- run the prediction on these images
- visualize the Neural Network's State to have a better understanding of the Convolution layer and how they react to your new images
###Here I will consider the rubric points individually and describe how I addressed each point in my implementation.
####1. Provide a Writeup / README that includes all the rubric points and how you addressed each one. You can submit your writeup as markdown or pdf. You can use this template as a guide for writing the report. The submission includes the project code.
You're reading it! and here is a link to my project code
###Data Set Summary & Exploration
####1. Provide a basic summary of the data set and identify where in your code the summary was done. In the code, the analysis should be done using python, numpy and/or pandas methods rather than hardcoding results manually.
The code for this step is contained in the 4 th code cell block of the jupyter notebook.
I used the numpy library of python to calculate the shape of train ,test and validation data sets signs data set:
- The size of training set is 34799
- The size of test set is 12630
- The shape of a traffic sign image is (32,32,3)
- The number of unique classes/labels in the data set is 42
####2. Include an exploratory visualization of the dataset and identify where the code is in your code file.
The code for this step is contained in the 5th code cell of the IPython notebook.
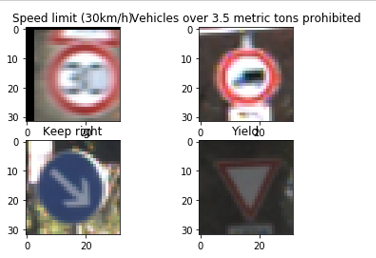
Here is an exploratory visualization of the data set. It is a bar chart showing how the data are distributed and some random pics are visualized with their sign type printed
###Design and Test a Model Architecture
####1. Describe how, and identify where in your code, you preprocessed the image data. What tecniques were chosen and why did you choose these techniques? Consider including images showing the output of each preprocessing technique. Pre-processing refers to techniques such as converting to grayscale, normalization, etc.
The code for this step is contained in the 7 th & 9 th code cell of the IPython notebook.
7th code block contains the preprocessing of data and generating additional train datas , 9th code block has the visualization of the normalized images
i used open cv , warpAffine to transform randomly selected images from train data
Note : i have not used any normalization on my model , because i found normalization not helping my model's prediction rate . feel free to apply normalization basic normalization of image data looks like (x-128)/128
####2. Describe how, and identify where in your code, you set up training, validation and testing data. How much data was in each set? Explain what techniques were used to split the data into these sets. (OPTIONAL: As described in the "Stand Out Suggestions" part of the rubric, if you generated additional data for training, describe why you decided to generate additional data, how you generated the data, identify where in your code, and provide example images of the additional data)
The code for splitting the data into training and validation sets is contained in the 1sy code cell of the IPython notebook.
The code for generating additional data is done on the 7 th block along with preprocessing
i used open cv , warpAffine to transform randomly selected images from train data
- randomly select 10000 images from train data
- apply wrapAffine transform to those image with randomly chosen transform value for width and height from (0,5) pixels
My final training set had 44799 number of images. My validation set and test set had 12630 and 4410 number of images.
i augmented the train dataset so that i can increase the distribution of the training data and reduce the possibility of overfitting by applying transformation
####3. Describe, and identify where in your code, what your final model architecture looks like including model type, layers, layer sizes, connectivity, etc.) Consider including a diagram and/or table describing the final model.
The code for my final model is located in the 16 th cell of the ipython notebook. function name (graph(X))
My final model consisted of the following layers:
| Layer | Description |
|---|---|
| Input | 32x32x3 RGB image |
| Convolution 3x3 | 1x1 stride, same padding, outputs 32x32x16 |
| Relu | |
| Max pooling 3x3 | 1x1 stride, same padding,outputs 32x32x16 |
| Convolution 5x5 | 3x3 stride, valid padding, outputs 10x10x64 |
| Relu | |
| Max pooling 3x3 | 1x1 stride, valid padding,outputs 8x8x64 |
| Convolution 3x3 | 1x1 stride, same padding, outputs 8x8x128 |
| Relu | |
| Convolution 3x3 | 1x1 stride, same padding, outputs 8x8x64 |
| Relu | |
| Max pooling 3x3 | 1x1 stride, outputs 6x6x64 |
| flatten | 2304 |
| Fully connected | 2304 ,1024 |
| Dropout | |
| Fully connected | 1024 , 1024 |
| Dropout | |
| Output | 1024 , 42 |
####4. Describe how, and identify where in your code, you trained your model. The discussion can include the type of optimizer, the batch size, number of epochs and any hyperparameters such as learning rate.
The code for training the model is located in the 21th cell of the ipython notebook.
1.create placeholders for X , Y , One_hot_y , dropout . create tf variables to hold weights , biases for convolute and fully connected layers 2. create logits using the graph function block 3. define cross_entropy , prediction , accuracy , optimizer , loss functions 4. run model for given epochs
####5. Describe the approach taken for finding a solution. Include in the discussion the results on the training, validation and test sets and where in the code these were calculated. Your approach may have been an iterative process, in which case, outline the steps you took to get to the final solution and why you chose those steps. Perhaps your solution involved an already well known implementation or architecture. In this case, discuss why you think the architecture is suitable for the current problem.
The code for calculating the accuracy of the model is located in the 22 nd cell of the Ipython notebook.
i carried out an iterative process for finding the correct parameters and model . firstly i designed a model and trained it . keeping that as benchmark , i started varying the epochs number , feature numbers for the convolute and fully connected layer , learning rate ,and dropout .
after a while , i landed on these parameters which works good for this Neural Network
My final model results were:
- training set accuracy of 97.7%
- validation set accuracy of 94.0%
- test set accuracy of 92.3%
If an iterative approach was chosen:
- LeNet was the first Architecture which i choose to classify this images . the problem of this architecture is , due to low training dataset , Lenet yield a very less accuracy for the validation and Test dataset
- i modified Lenet architecture by adding additional convolute layers at he top , i added a dropout layer for the fullyconnected layer and changed the feature map for the convolute layers . i used relu as the activation layer .
- i started varying the epochs number to land on a optimal value , later i worked with feature numbers for the convolute layers and fullyconnected layers . learining rate was challenging , because lower rate made the process of training slow but goes in the rite path where higher rate gives high accuracy in the beginning but jumps the optimal value in the end . choosing a value i = right in the middle was challenging . dropout where useful parameter to increase the validation accuracy .
###Test a Model on New Images
####1. Choose five German traffic signs found on the web and provide them in the report. For each image, discuss what quality or qualities might be difficult to classify.
Here are five German traffic signs that I found on the web:
The 5 th image might be difficult to classify because the picture of the right turn is surrounded by blue color which might get confused with red of no entry sign
####2. Discuss the model's predictions on these new traffic signs and compare the results to predicting on the test set. Identify where in your code predictions were made. At a minimum, discuss what the predictions were, the accuracy on these new predictions, and compare the accuracy to the accuracy on the test set (OPTIONAL: Discuss the results in more detail as described in the "Stand Out Suggestions" part of the rubric).
The code for making predictions on my final model is located in the 24th cell of the Ipython notebook.
Here are the results of the prediction:
| Image | Prediction |
|---|---|
| Speed limit (20km/h) | 'Speed limit (30km/h) |
| Speed limit (60km/h) | Speed limit (60km/h) |
| Child crossing | Child crossing |
| Wild animals crossing | Wild animals crossing |
| Turn right | No entry |
 The model was able to correctly guess 4 of the 5 traffic signs, which gives an accuracy of 80%. This compares favorably to the accuracy on the test set of ...
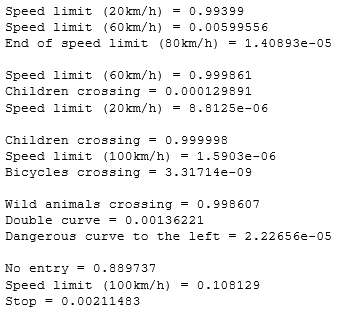
####3. Describe how certain the model is when predicting on each of the five new images by looking at the softmax probabilities for each prediction and identify where in your code softmax probabilities were outputted. Provide the top 5 softmax probabilities for each image along with the sign type of each probability. (OPTIONAL: as described in the "Stand Out Suggestions" part of the rubric, visualizations can also be provided such as bar charts)
The code for making predictions on my final model is located in the 26th cell of the Ipython notebook.


