This is a simple tool to convert SVG files to MxGraph XML files.
It is used to import vector graphics into Draw.io (which is based on MxGraph).
It allows to apply styles to the graphic, such as fill color, stroke color, stroke width, and opacity.

-
Draw a vector graphic in a SVG editor (e.g. Inkscape, or Adobe Illustrator).
-
Save the graphic as a SVG file.
-
Run the tool to convert the SVG file to a MxGraph XML file.
python -m svg2mxgraph assets/cheese.svg
which outputs the MxGraph XML to the console.
<?xml version="1.0" ?>
<shape aspect="variable" h="91.5" w="91.5" strokewidth="inherit">
        <connections>
                <constraint x="0" y="0.25" perimeter="1"/>
                <constraint x="1" y="0.25" perimeter="1"/>
                <constraint x="0.25" y="0" perimeter="1"/>
                <constraint x="0.25" y="1" perimeter="1"/>
                <constraint x="0" y="0.5" perimeter="1"/>
                <constraint x="1" y="0.5" perimeter="1"/>
                <constraint x="0.5" y="0" perimeter="1"/>
                <constraint x="0.5" y="1" perimeter="1"/>
                <constraint x="0" y="0.75" perimeter="1"/>
                <constraint x="1" y="0.75" perimeter="1"/>
                <constraint x="0.75" y="0" perimeter="1"/>
                <constraint x="0.75" y="1" perimeter="1"/>
        </connections>
        <background>
                <rect x="0" y="0" w="91.5" h="91.5"/>
        </background>
        <foreground>
                <fillstroke/>
                <rect x=".5" y=".5" width="90.5" height="90.5"/>
                <stroke/>
                <path>
                        <move x="61.09" y="19.17"/>
                        <line x="30.4" y="19.17"/>
                        <line x="" y=""/>
                        <line x="" y=""/>
                        <line x="15.06" y="45.75"/>
                        <line x="30.4" y="72.32"/>
                        <line x="61.09" y="72.32"/>
                        <line x="76.44" y="45.75"/>
                        <line x="61.09" y="19.17"/>
                </path>
                <stroke/>
                <path>
                        <move x="30.4" y="72.32"/>
                        <line x="61.09" y="19.17"/>
                </path>
                <stroke/>
                <path>
                        <move x="76.44" y="45.75"/>
                        <line x="15.86" y="45.75"/>
                </path>
                <stroke/>
                <path>
                        <move x="30.4" y="19.17"/>
                        <line x="61.09" y="72.32"/>
                </path>
                <stroke/>
        </foreground>
</shape>
-
Copy the XML to the clipboard.
-
From Draw.io, go to
Arrange/Insert/Shape... -
Paste the XML into the
Edit Datafield. -
Hit
Previewto see the graphic. -
Hit
Applyto insert your chapess into the diagram.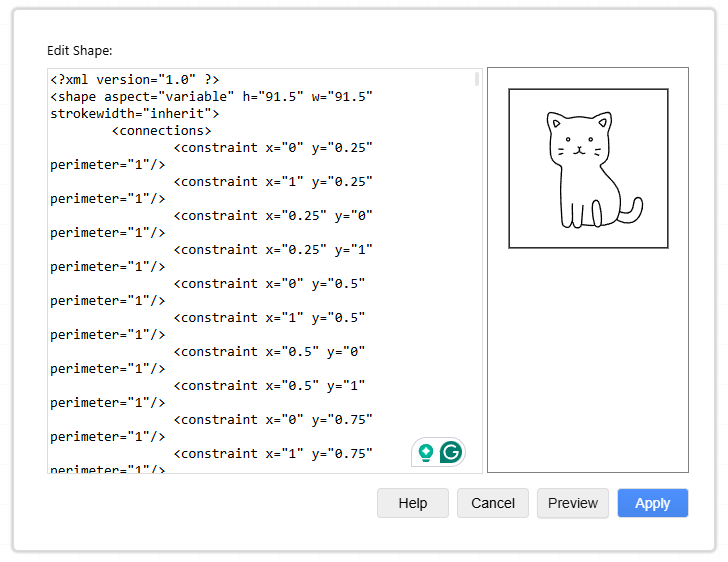

- The tool does not support all SVG features.
- It is a proof of concept, and may not work with all SVG files.
- Feel free to contribute to the project.