Use emoji in ggplot2 scatter plot
yuanxuan yang
This is a tutorial of using emoji (or other images) in ggplot2 scatter plot. Our task is to create a map (scatter plot) to show the “most popular vegetable by state in US”, where each state is represented by vegetable emoji. It would be good to generate some visual outputs similar to the grid maps as shown in this article.
1. Get the data
The most popular vegetable data is obtained from https://www.thedailymeal.com/eat/popular-vegetable-us-states, I have tidied up and stored the information in “data/state-fav-veg.csv” in this repository.
Now let’s load the R package and have a look at our data records.
library(tidyverse)
library(ggtext)state_veg<-read.csv("data/state-fav-veg.csv")
head(state_veg)## name vegetable
## 1 Alabama Broccoli
## 2 Alaska Tomato
## 3 Arizona Broccoli
## 4 Arkansas Carrot
## 5 California Broccoli
## 6 Colorado Broccoli
Each record in the “state_veg” contains the name and most popular vegetable of a state in the US.
The next thing to do is to get the coordinates/location of each state. So I followed the design of Katie Park’s work in this twitter post, and the coordinates are stored in the “data/state-location-grid.csv”.
state_location<-read.csv("data/state-location-grid.csv")
head(state_location)
## code name x y
## 1 AL Alabama 7 2
## 2 AK Alaska 1 8
## 3 AZ Arizona 2 3
## 4 AR Arkansas 5 3
## 5 CA California 1 4
## 6 CO Colorado 3 4
Each record contains the code (Two-Letter Abbreviations), name and x, y coordinate of a state in the US. we can have a quick look at their location:
state_location %>%
  ggplot()+
  geom_point(aes(x=x,y=y),color="#6abe83",size=10)+
  geom_text(aes(x=x,y=y,label=code))+
  theme_minimal()+
  coord_fixed()
We then join the state_veg and state_location, and make a basic scatter plot using ggpplot2. The dot’s color represent different vegetable types.
state_veg <- state_veg %>%
  left_join(state_location %>%
              dplyr::select(code,name,x,y),by = c("name"="name"))
state_veg$vegetable<-factor(state_veg$vegetable,levels = c("Broccoli", "Tomato",   "Carrot",   "Cucumber", "Corn"))

state_veg  %>%
  ggplot()+
  geom_point(aes(x=x,y=y,color=vegetable),size=10)+
  geom_text(aes(x=x,y=y,label=code))+
  scale_color_manual(values = c("#739e3b","#C1292E","#FD7013","#AFEAAA","#FFD800"))+
  ggtitle("Most Popular Vegetable by State in US")+
  theme_minimal()+
  coord_fixed()
2. Emoji Time
The scatter plot above Looks good so far, but why not replace the boring dots with some emoji vegetables? Let’s do it!
I have tried different ways of using emoji in ggplot, although there are approaches like emojifont and emoGG, they tend to use the flat version of emoji. As a Apple Fanboy (not really), i prefer the classic apple version a bit more.
So today I will go for an alternative and still very simple method - using the geom_richtext provided in ggtext package. This approach is inspired by Emil Hvitfeldt’s brilliant blog post. So let’s get started!
2.1 Get the emoji
You can find and download all emoji from https://emojipedia.org/. Once downloaded, we can create a dataframe to store the links/address (at your local machine) to them, as shown below
emoji_pic<-data.frame(
  vegetable = c("Broccoli", "Tomato", "Carrot", "Cucumber", "Corn"),
  emoji_link = c("img/broccoli_1f966.png",
                 "img/tomato_1f345.png",
                 "img/carrot_1f955.png",
                 "img/cucumber_1f952.png",
                 "img/ear-of-corn_1f33d.png"
  )
)

head(emoji_pic)
## vegetable emoji_link
## 1 Broccoli img/broccoli_1f966.png
## 2 Tomato img/tomato_1f345.png
## 3 Carrot img/carrot_1f955.png
## 4 Cucumber img/cucumber_1f952.png
## 5 Corn img/ear-of-corn_1f33d.png
2.2 Join the dataframe
We then need to join state_veg and the emoji_pic data by the common variable of “vegetable”, as a result, each record will contain the string of link to the emoji.
state_veg <- state_veg %>%
  left_join(emoji_pic,by = c("vegetable" = "vegetable"))
state_veg$vegetable<-factor(state_veg$vegetable,levels = c("Broccoli", "Tomato",   "Carrot",   "Cucumber", "Corn"))
Once joined, our data is finally ready, let’s have a look
head(state_veg)## name vegetable code x y emoji_link
## 1 Alabama Broccoli AL 7 2 img/broccoli_1f966.png
## 2 Alaska Tomato AK 1 8 img/tomato_1f345.png
## 3 Arizona Broccoli AZ 2 3 img/broccoli_1f966.png
## 4 Arkansas Carrot AR 5 3 img/carrot_1f955.png
## 5 California Broccoli CA 1 4 img/broccoli_1f966.png
## 6 Colorado Broccoli CO 3 4 img/broccoli_1f966.png
2.3 Define a function to provide more infomation for your emoji images
We will use geom_richtext to draw the data point in a scatter chart, and replace the point shape with emoji. geom_richtext draws labels similar to ggplot::geom_label, but formatted using basic markdown/html. Therefore, it is possible to embed images in the richtext labels. Here we are going to define a function so that the emoji can be added and formatted as a resource in markdown/html.
func_link_to_img <- function(x, size = 30) {
  paste0("<img src='", x, "' width='", size, "'/>")
}
2.4 Moment of Truth
Now let’s try to replace the geom_point with geom_richtext
using
![]()
![]()
![]()
![]()
![]()
ggplot()+
  geom_text(data = state_veg ,aes(x=x,y=(y-0.3),label=code,color=vegetable),
            size=8,alpha=0.8,family="Arial Black")+ # the Two-Letter Abbreviations of each state
  scale_color_manual(values = c("#739e3b","#d9534f","#FD7013","#AFEAAA","#FFD800"))+
  geom_richtext(data = state_veg,
                aes(x=x,y=y,label=func_link_to_img(emoji_link)),
                fill= NA,label.color = NA)+ # remove background and outline
  theme_minimal()+
  coord_fixed()+
  theme(    axis.title=element_blank(),
            axis.text=element_blank(),
            panel.grid=element_blank(),
            strip.text=element_blank(),
            legend.position = "none",
  )
Hurray, it works! So again we can make some further tweaks, add a vintage-paper look background color, change the font style, add title and data source info. Hope you like this imporved version!
ggplot()+
  geom_text(data = state_veg ,aes(x=x,y=(y-0.35),label=code),
            color="black",size=7,alpha=0.6,family="Arial Black")+ # add Abbreviations
  geom_text(data = state_veg ,aes(x=(x+0.01),y=(y-0.32),label=code,color=vegetable),
            size=7,alpha=1,family="Arial Black")+ # add a shade for the Abbreviations
  geom_text(aes(x=9.5,y=0.87),
            label="Data source \nhttps://www.thedailymeal.com/\neat/popular-vegetable-us-states\nTwitter @yyuanxuan",
            color="#bc8420",
            size=2,hjust = 0,family="Impact")+
  geom_text(aes(x=5.5,y=7.6),label="Most Popular Vegetable \nby State in US",color="#393E46",
            size=6,family="Silom")+
  geom_richtext(
    data = state_veg,
    aes(x=x,y=y,label=func_link_to_img(emoji_link)),
    fill= NA,label.color = NA)+ # remove background and outline
  scale_color_manual(values = c("#739e3b","#d9534f","#FD7013","#AFEAAA","#FFD800"))+
  xlim(0,12)+
  ylim(0,8.5)+
  theme_minimal()+
  coord_fixed()+
  theme(axis.title.x =element_blank(),
        axis.title.y = element_blank(),
             axis.text=element_blank(),
             panel.grid=element_blank(),
             strip.text=element_blank(),
            plot.background = element_rect(fill = "#fff1c1",color="#fff1c1"),
            legend.position = "none",
            plot.title = element_text(hjust = 0.5,vjust=-10)

  )
3. Final note
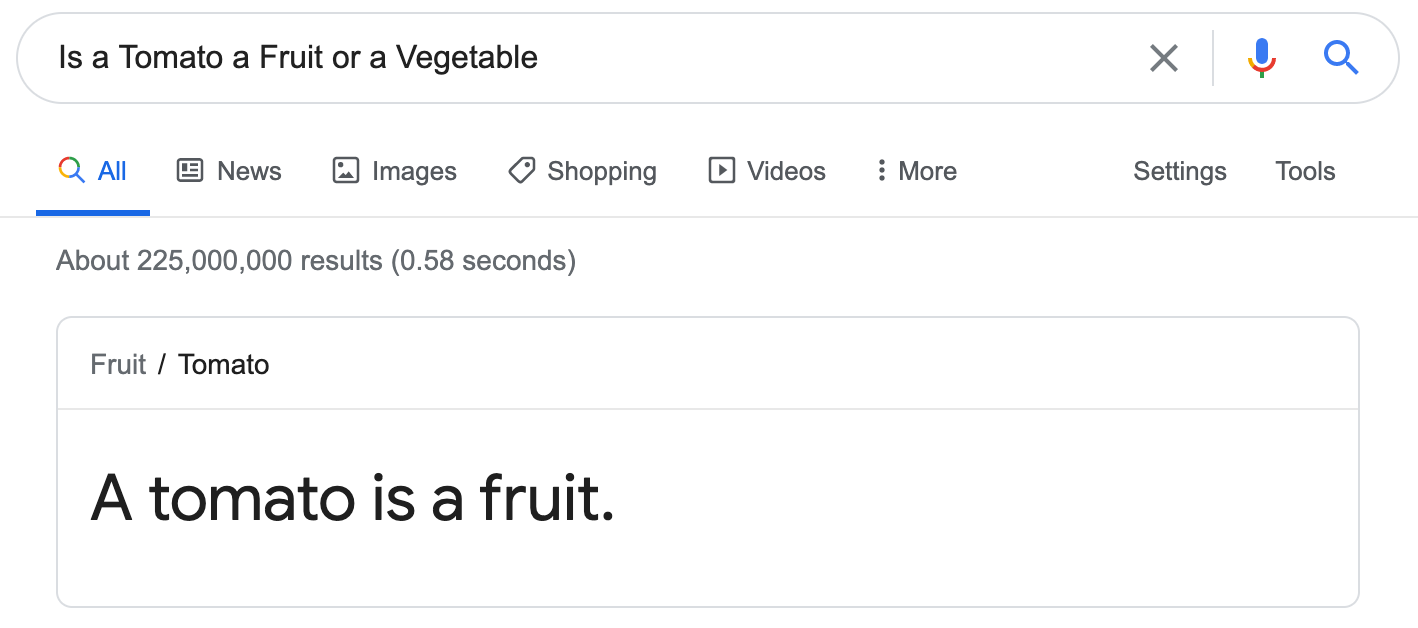
Making this map does not mean that I agree with everything presented in it. First of all, we could argue all day about “Is a Tomato a Fruit or Vegetable?”
Here is the answer from GoogleAother benefit of the presented method (using the geom_richtext), is that we can use any images we want for plotting the dots, while emojifont and emoGG can only provide us the choice of emoji. Here I replaced the corn with an copyright-free image of popcorn. :)


