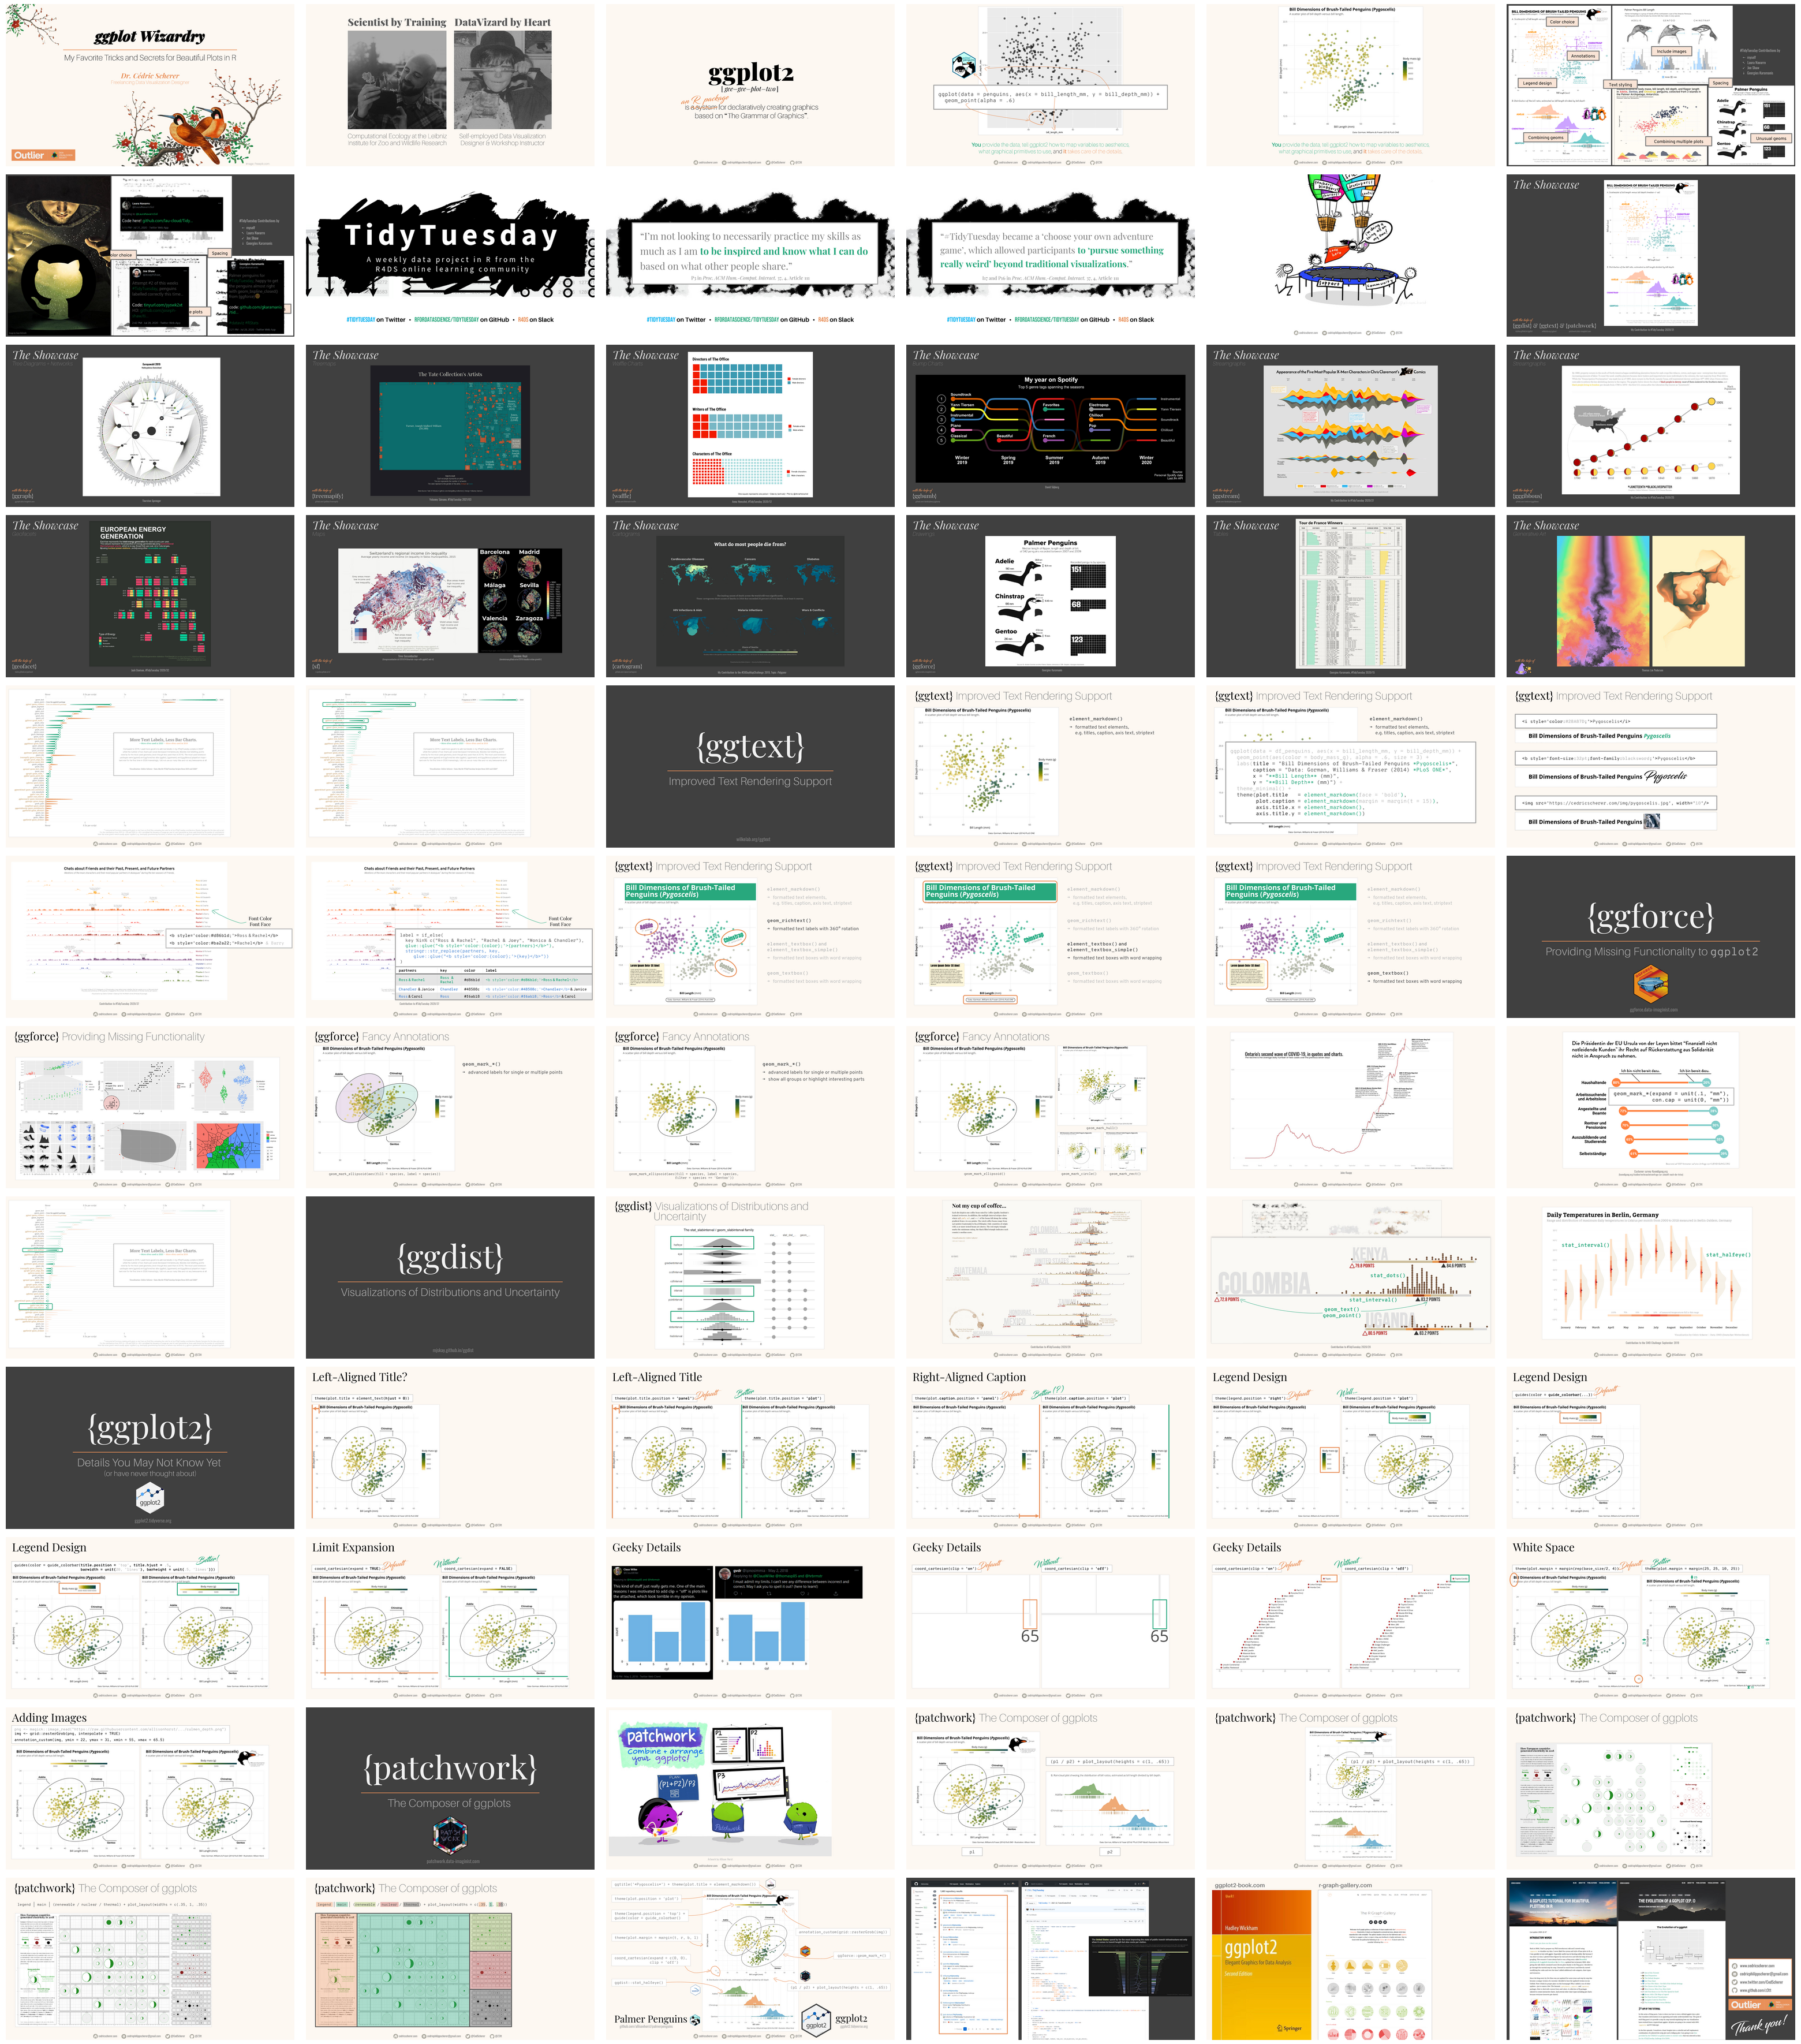
Slides and hands-on codes for my talk at the 1st OutlierConf, February 4–7 2021.
Bonus: Extended version!
In this talk, I present my favorite tips and tricks with regard to the ggplot2 package, a library for plotting in the programming language R. I will cover functions that are helpful but many may not be aware of as well as a collection of interesting functions from a large range of extension packages.
The talk is intended for people who already know how to code in R and ggplot2. However, I am going to cover a diverse collection of tips so I hope everyone can pick something helpful independent from their level of expertise.
- Intro to R (one of many good online tutorials)
- "R for Data Science" book (open-access)
- ggplot2 Book (open-access)
- R Graph Gallery
- My extensive ggplot2 tutorial
- My “Evolution of a ggplot” blog post
- #TidyTuesday project (#TidyTuesday on Twitter)
- My #TidyTuesday Contributions incl. all codes
- R4DS learning community (huge Slack community for people learning R incl. a mentoring program)
- Illustrations by Allison Horst (more general about data and stats + R-related)
- R Packages mentioned:


