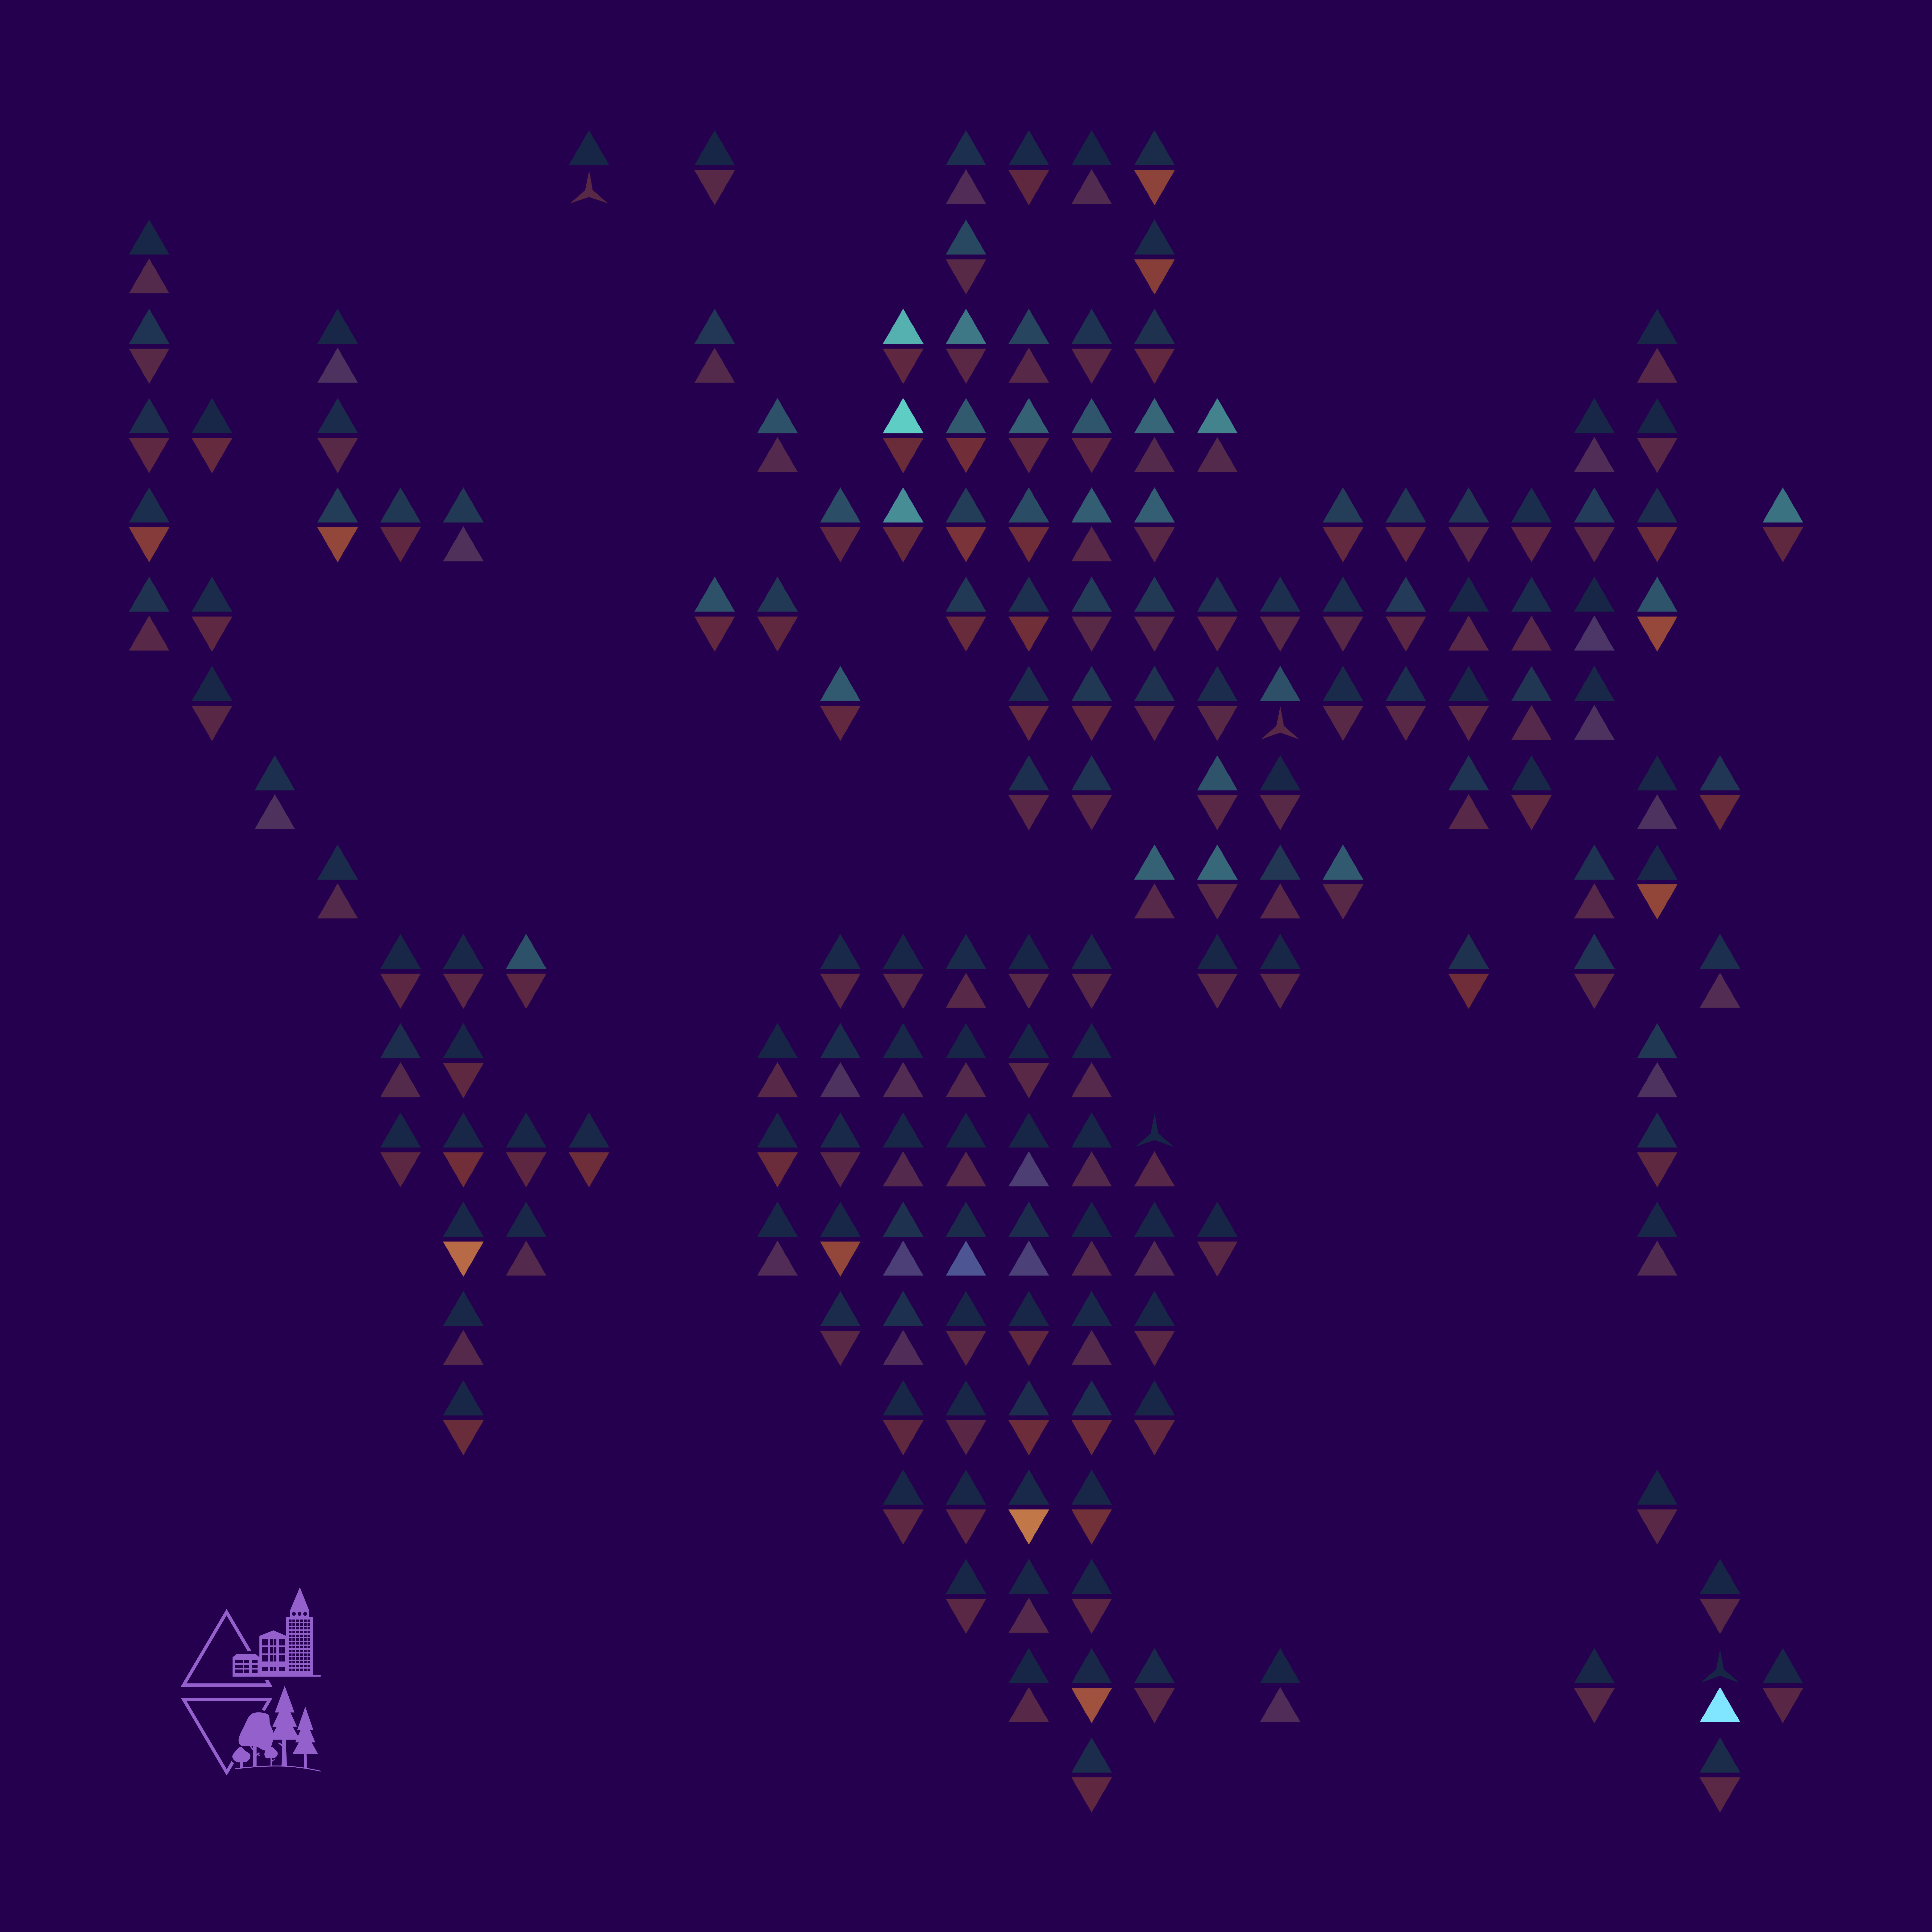
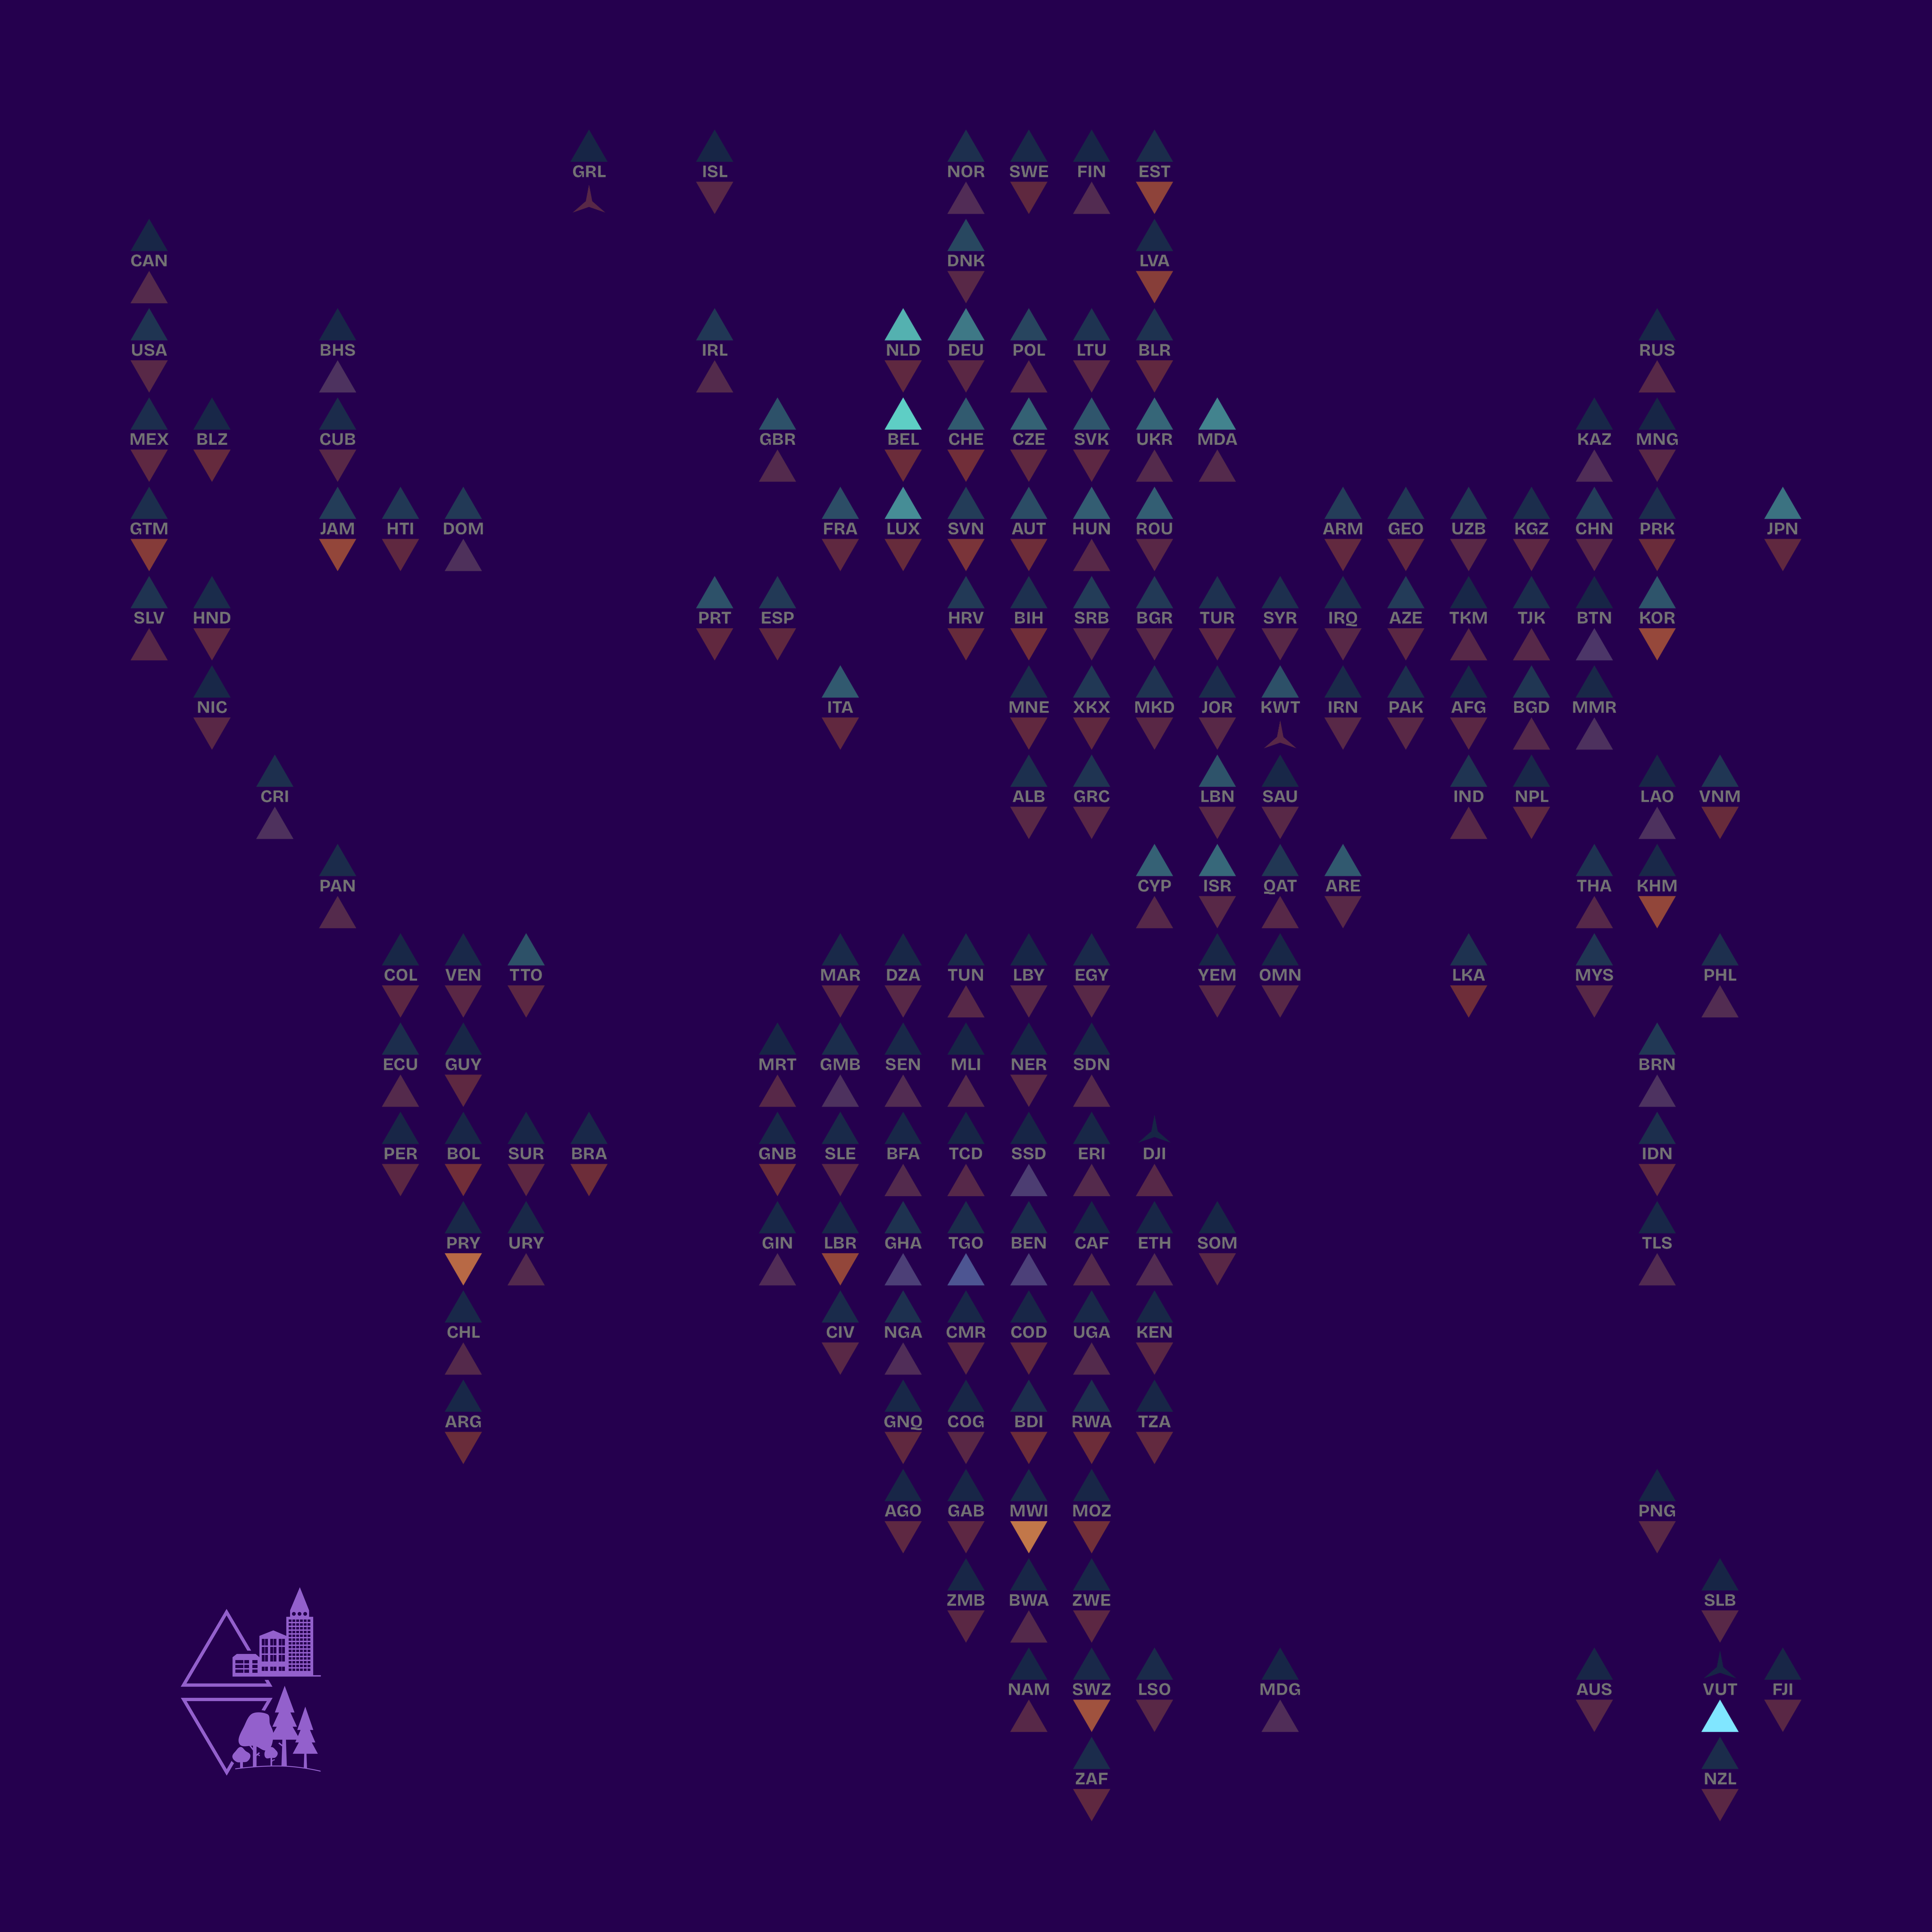
Relative change in urban and tree-covered areas (1992-2015)
Contribution to the ESA Little Pictures of Climate Competition 2023.
The graphic visualizes the relative change in urban (upper triangle) and tree-covered areas (lower triangle) between 1992 and 2015 per country in relation to its size as a global tile grid map. The lighter the color the higher the change; the direction of the triangles hereby indicates the overall trend with triangles pointing upwards indicating an increase and those pointing downwards encoding a decrease (rotor-like symbols indicate no change). Tree-covered areas are defined as all land cover classes that feature any kind of trees, except cropland. While the relative change in urban areas is never negative, the patterns of change in tree-covered areas differ a lot with 114 countries experiencing a decrease and 57 an increase.

