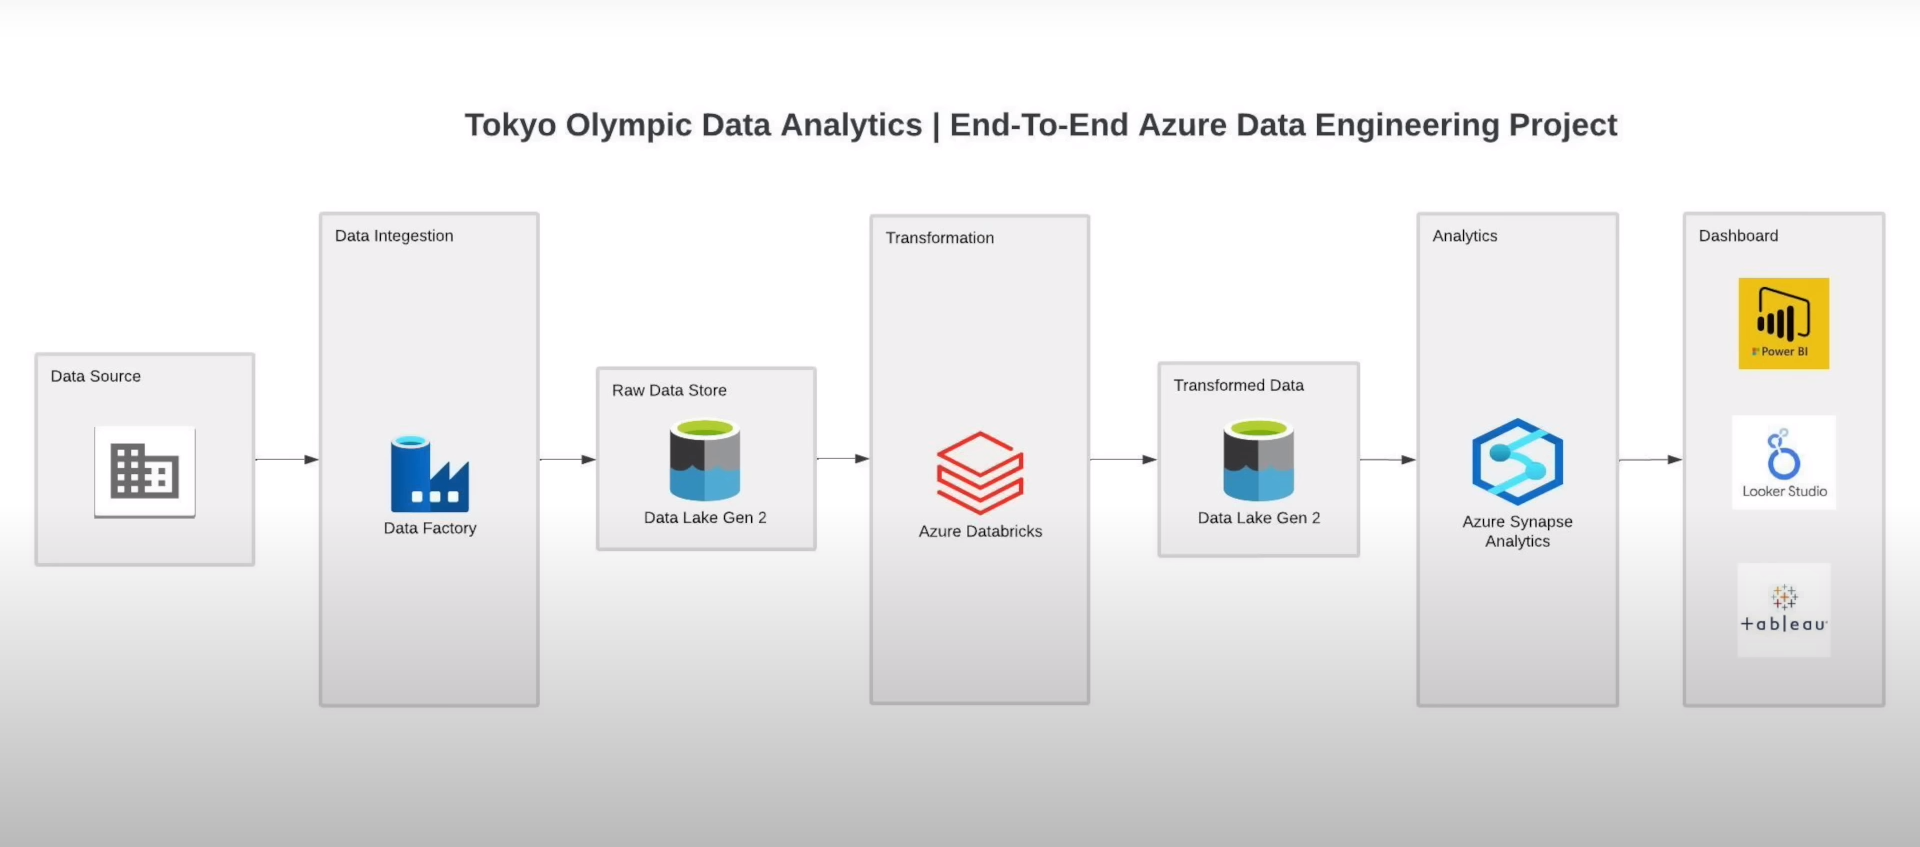
This project provides a data engineering and analytical journey on the Tokyo Olympic dataset. Starting with a CSV on GitHub, the data is ingested into the Azure ecosystem via Azure Data Factory. It's initially stored in Azure Data Lake Storage Gen2, then transformed in Azure Databricks. The enriched data, once again housed in ADLS Gen2, undergoes advanced analytics in Azure Synapse. The insights are finally visualized in Azure Synapse or Power BI, offering a comprehensive view of the dataset.
This contains the details of over 11,000 athletes, with 47 disciplines, along with 743 Teams taking part in the 2021(2020) Tokyo Olympics. This dataset contains the details of the Athletes, Coaches, Teams participating as well as the Entries by gender. It contains their names, countries represented, discipline, gender of competitors, name of the coaches.
Source(Kaggle): 2021 Olympics in Tokyo
- Azure Data Factory: For data ingestion from GitHub.
- Azure Data Lake Storage Gen2: As the primary data storage solution.
- Azure Databricks: For data transformation tasks.
- Azure Synapse Analytics: To perform in-depth data analytics.
- Create Azure Free Subscription account
- Create a Resource Group 'tokyo-olympic-data' to house and manage all the Azure resources associated with this project.
- Within the created resource group, set up a storage account. This is specifically configured to leverage Azure Data Lake Storage(ADLS) Gen2 capabilities.
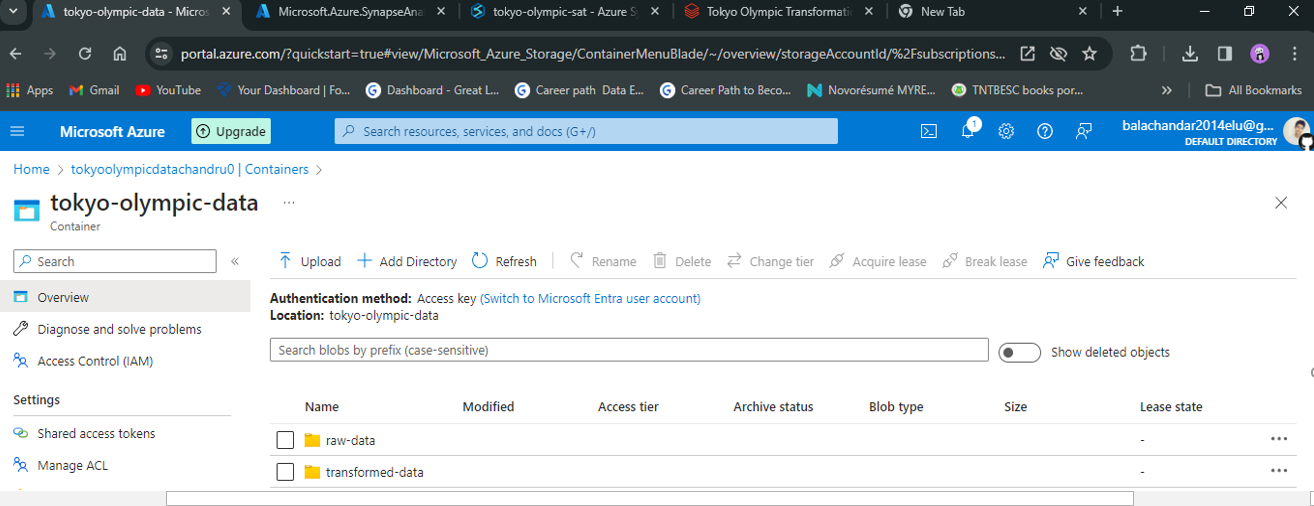
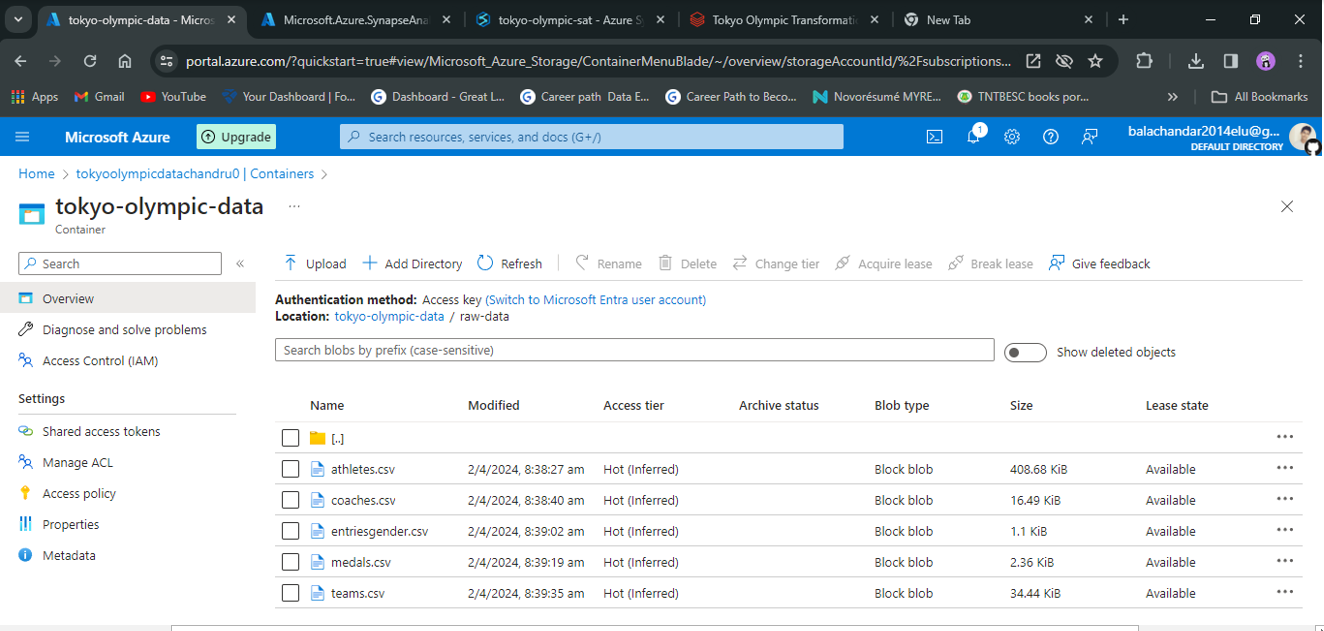
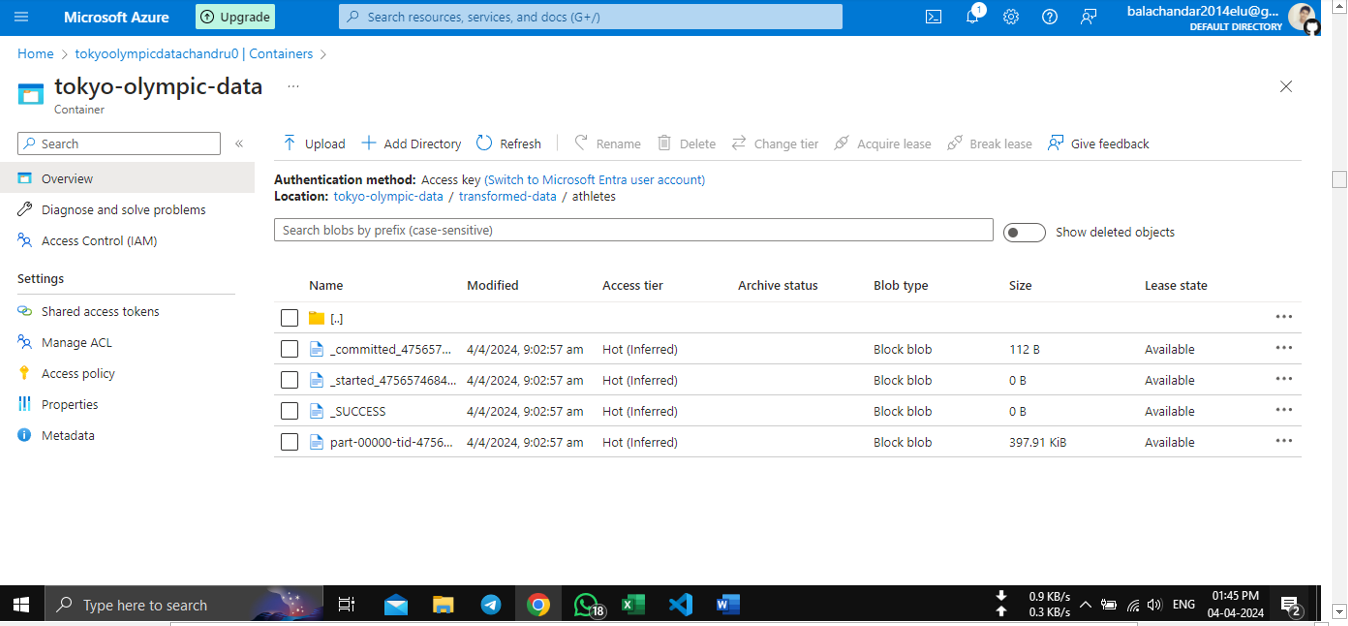
- Create a Container inside this storage account to hold the project's data. Two directories 'raw-data' and 'transformed-data' are created to store raw data and transformed data.
- Begin by creating an Azure Data Factory workspace within the previously established resource group.
- After setting up the workspace, launch the Azure Data Factory Studio.
- Upload the Tokyo Olympics dataset from kaggle to GitHub.
- Within the studio, initialize a new data integration pipeline. Now use the task Copy Data to move data efficiently between various supported sources and destinations.
- Configuring the Data Source with HTTP template as we are using http request to get the data from Github repo.
- Establishing the Linked Service for source.
- Configuring the File Format for and setting up the Linked Service Sink.
- Repeat above steps to load all the datasets.
- You can connect all the copy data activity together and run them all at once.
- Navigate to Azure Databricks within the Azure portal and create a workspace within the previously established resource group and launch it.
- Configuring Compute in Databricks
- Create a new notebook within Databricks and rename it appropriately, reflecting its purpose or the dataset it pertains to.
- Establishing a Connection to Azure Data Lake Storage (ADLS).
- Using the credentials (Client ID, Tenant ID, Secret), write the appropriate code in the Databricks notebook to mount ADLS.
- Writing Data Transformations mount ADLS Gen2 to Databricks.
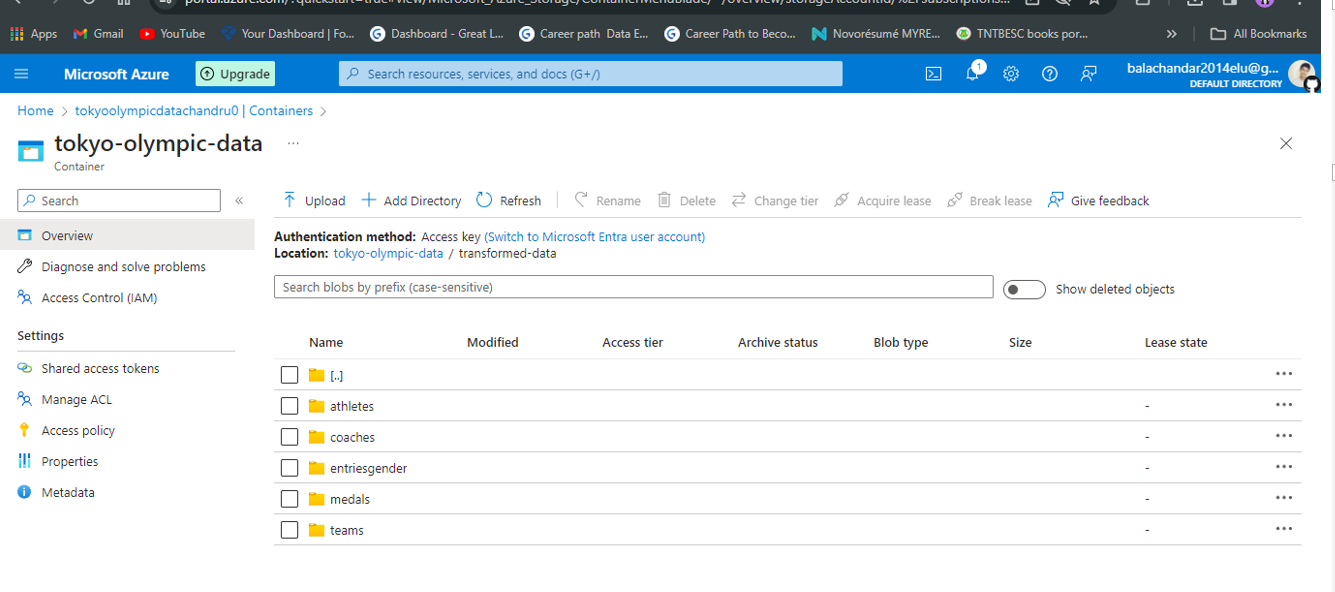
- Writing Transformed Data to ADLS Gen2.
Tokyo Olympics Transformation.ipynb
- Creating a Synapse Analytics Workspace.
- Within Workspace navigate to the "Data" section, choose "Lake Database" and create a Database "TokyoOlympicDB"
- Creating Table from Data Lake from the Transformed Data folder within your ADLS Gen2 storage.
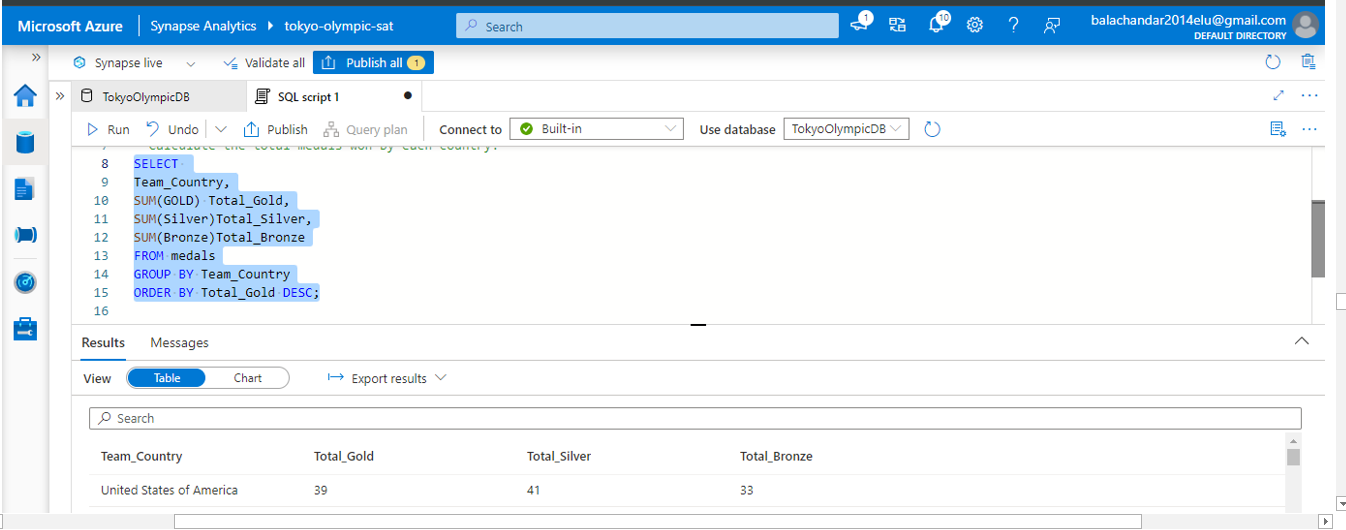
Create SQL script to Perform Exploratory data analysis using SQL.
You can also use PowerBI to generate your analysis reports.
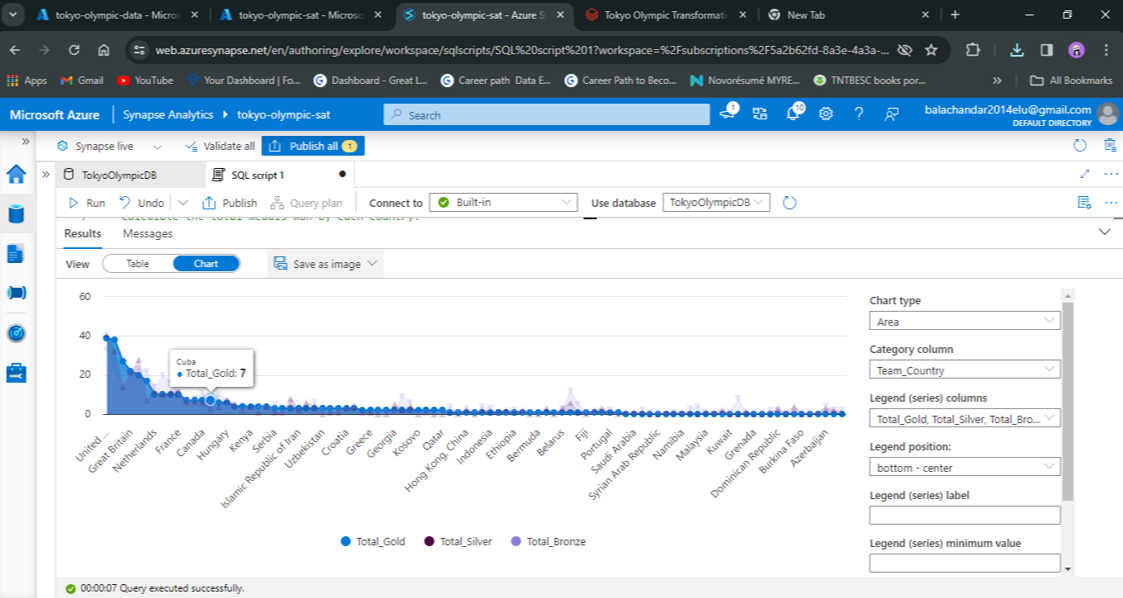 Dashboard Created.
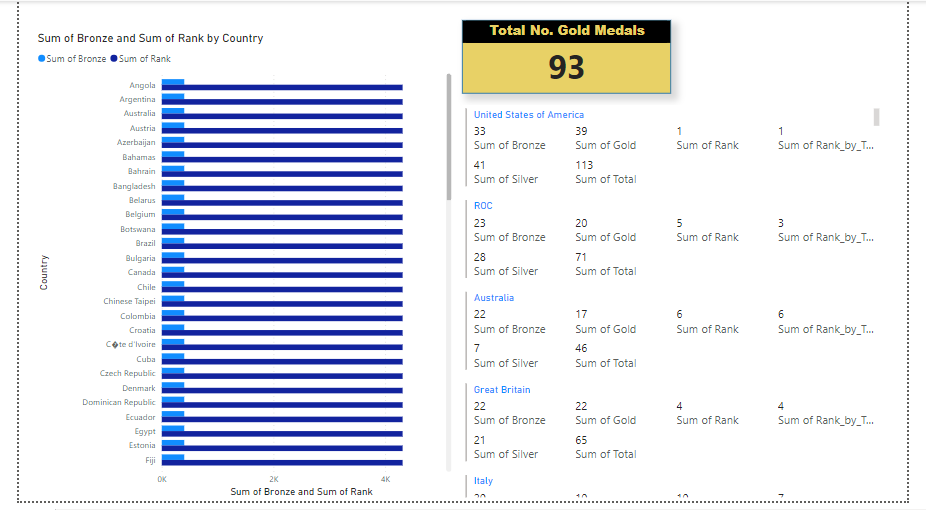
Refer to the SQL scripts used for data analysis Tokyo Olympics SQL script.sql
