- Understand how Artificial Intelligence and Machine Learning are applied in the banking industry.
- Understand the theory and intuition behind Deep Neural Networks.
- Import key Python libraries, dataset, and perform Exploratory Data Analysis (EDA).
- Perform data visualization using Seaborn.
- Standardize the data and split them into train and test datasets.
- Build a deep learning model using Keras with Tensorflow 2.0 as a back-end.
- Assess the performance of the model and ensure its generalization using various KPIs.
- In this hands-on project, we will assume that you work as a data scientist at a bank
- In this project, we aim to build and train a deep neural network model to predict the likelihood of liability customers (depositors) buying personal loans based on customer features such as age, experience, income, location, family, education, existing mortgage, credit cards, etc.
- Lenddo (https://lenddo.com) is a leading startup that uses advanced machine learning to analyze over 12,000+ features from various sources of data to predict an individual’s creditworthiness (e.x: social media count use, geolocation data, etc,)

- Most bank customers are depositors and the bank would like to start targeting those customers and issue personal loans to them
- The bank would like to retain those depositors and convert them to personal loan customers and therefore growing annual revenue
- In the past, the bank ran a marketing campaign that resulted in a 9% success rate.
- The bank management team would like to analyze this campaign results and develop a model to target customers who have high probability of obtaining personal loans.
| Column Name | Column Description |
|---|---|
| ID | Customer ID |
| Age | Customer's age in yearrs |
| Experience | Number of years of professional experience |
| Income | Annual income of customer ($000) |
| Zipcode | Home Adress Zip Code |
| Family | Family size of the customer |
| CCAvg | Average spending on credit cards per months ($000) |
| Education | Education level (1: Undergrad;2: Graduated, 3: Advanced/Professional) |
| Mortgage | Value of house mortgage ($000) |
| Personal Loan | Did this customer accept the personal loan offered in the last campaign or not? |
| Security Account | Does the customer have a securities account with the bank? |
| Online | Does the customer use internet banking facilities? |
| Credit Card | Does the customer uses a credit card issued by UniversalBank |
- Pandas: Dataframe manipulating library
- Numpy: Numerical values, arrays, matrices handling library
- Matplotlib & Seaborn: Data visualization libraries
- Tensorflow: Google framework for building and train AI model
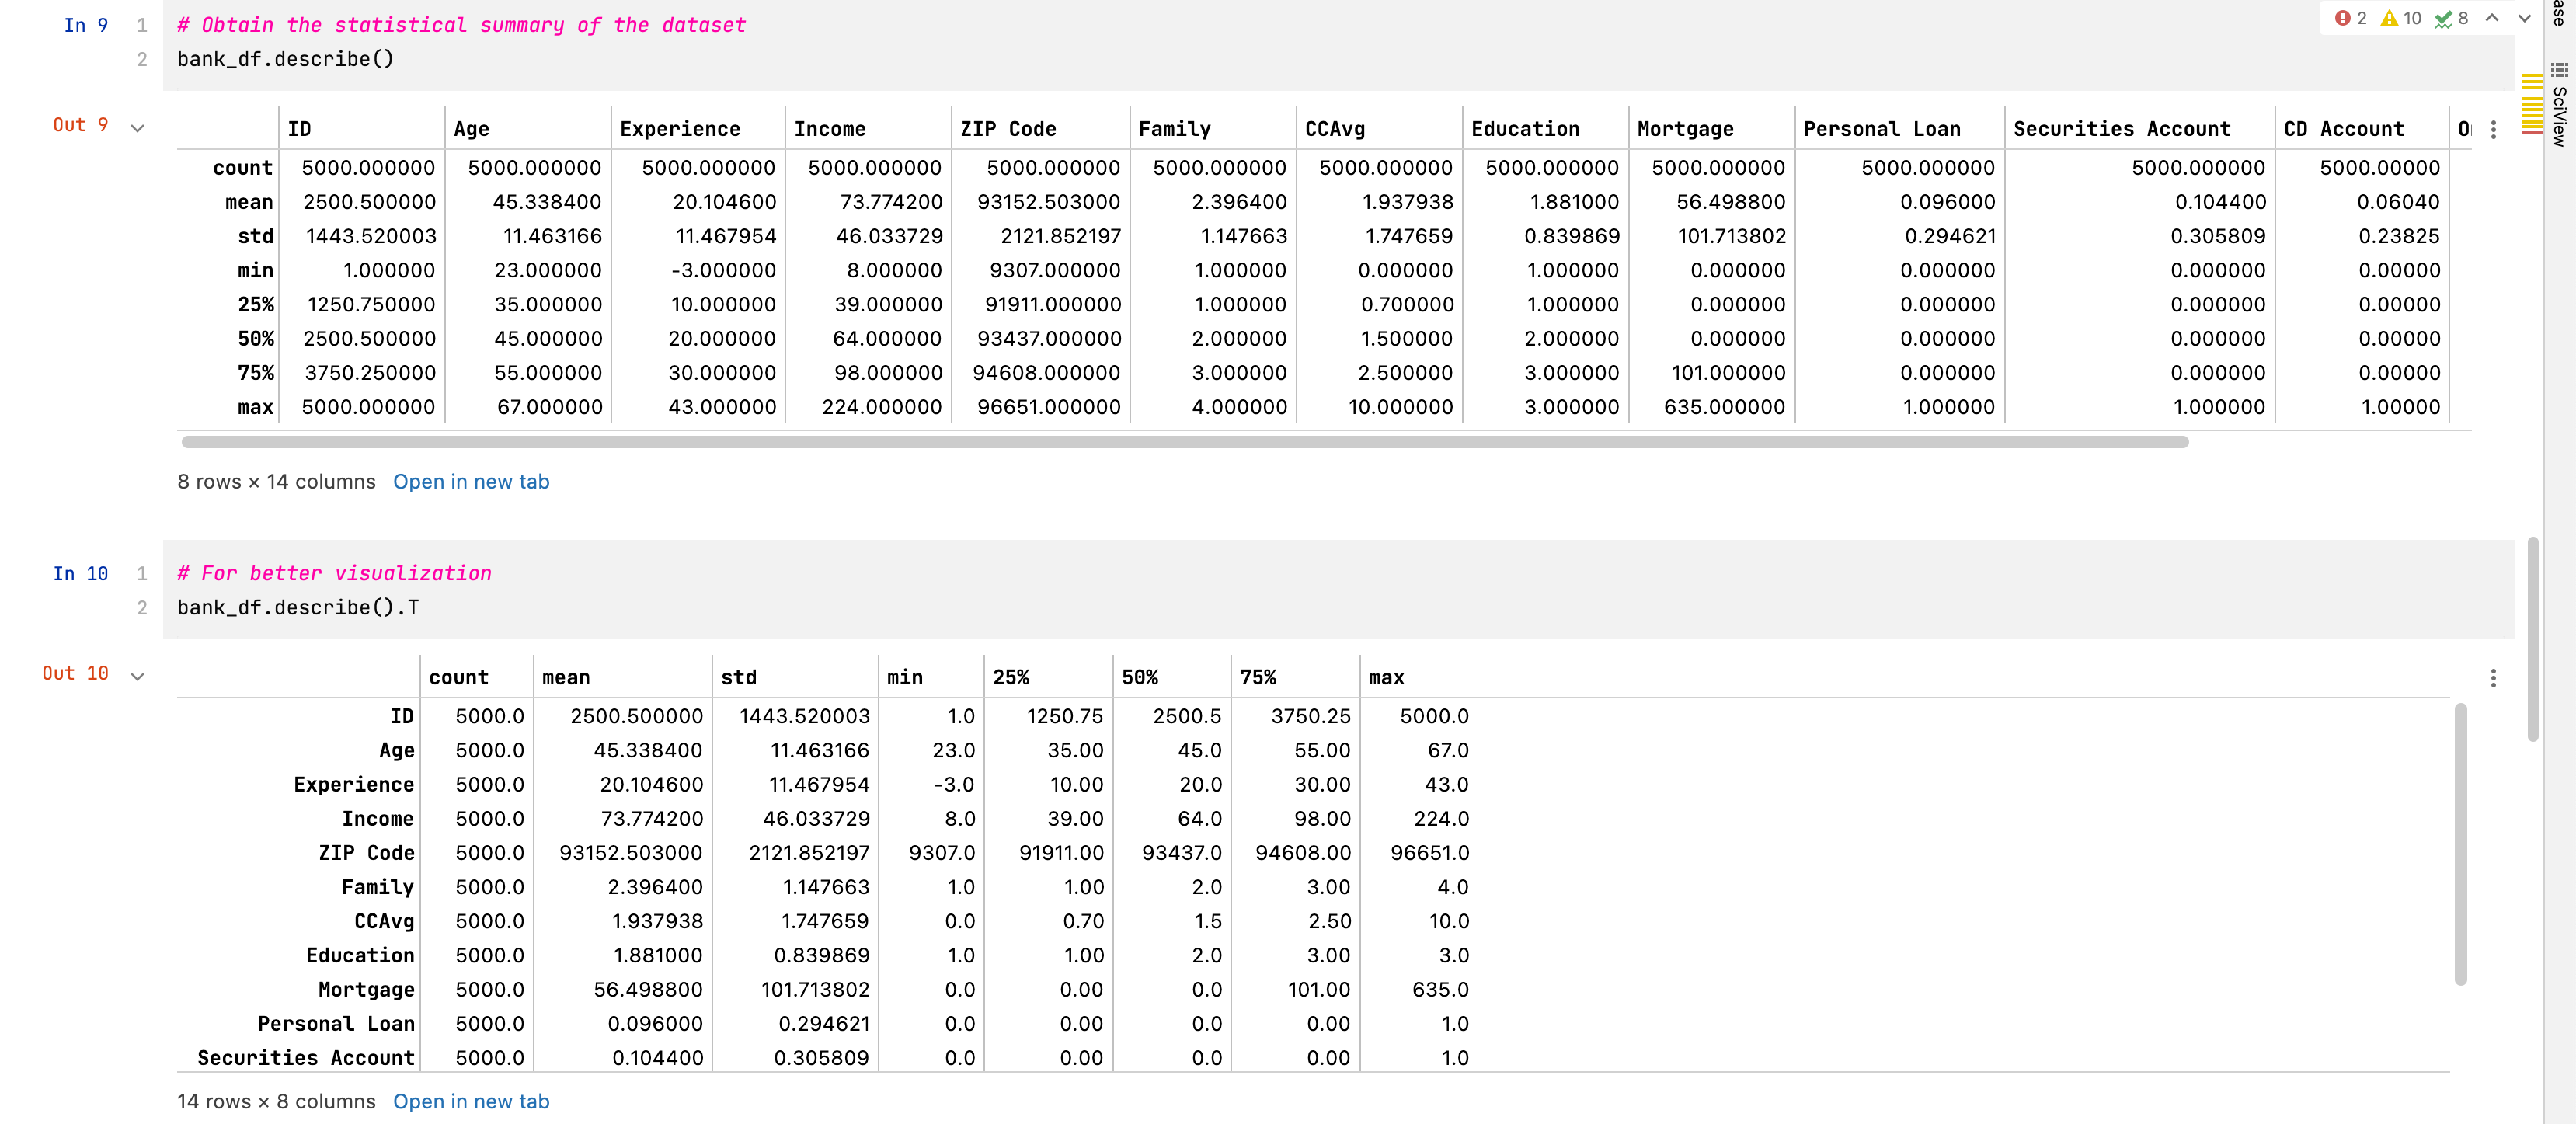
- The dataframe contains 5000 rows
- The dataframe contains 14 columns in total
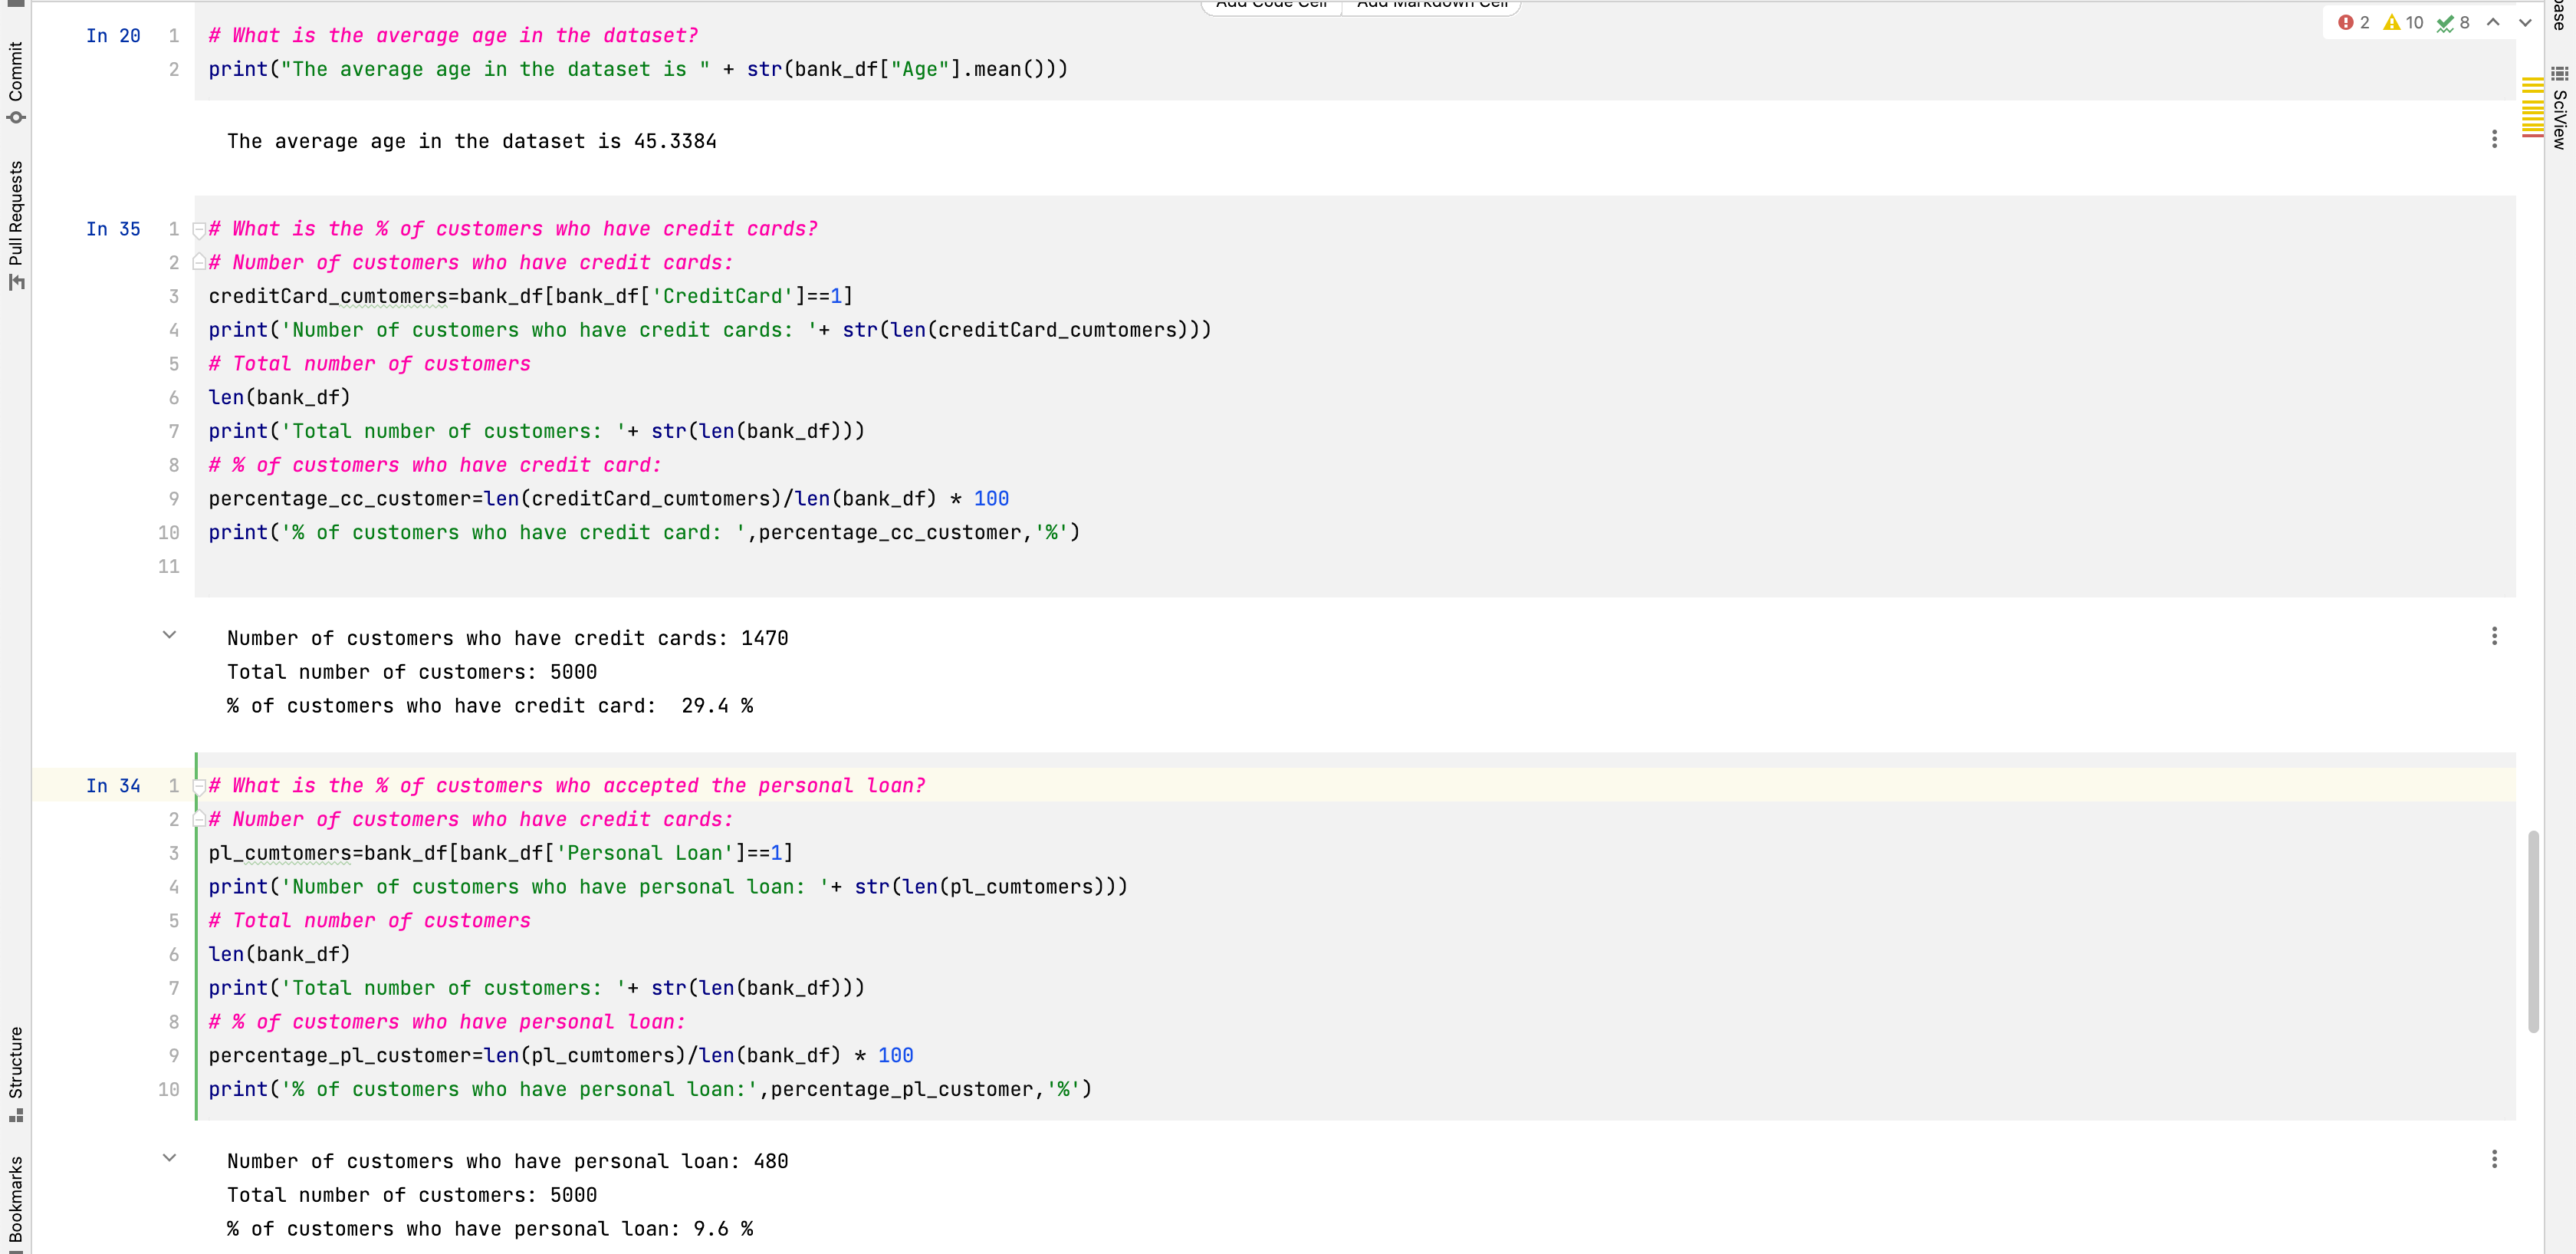
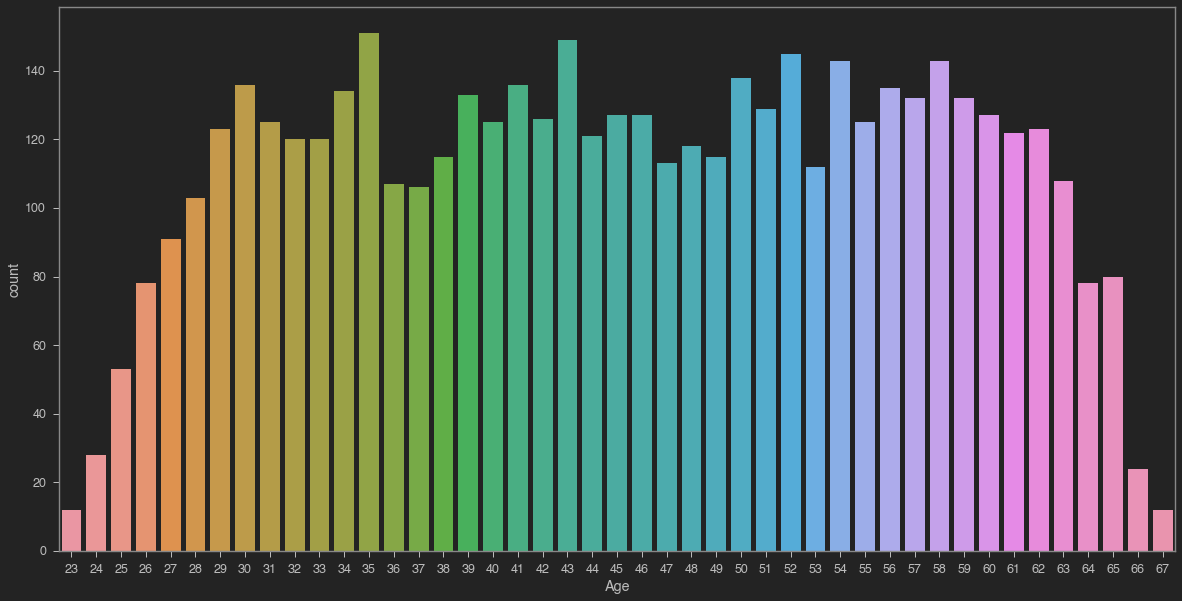
- Customers range in age from 23 to 67, with an average age of 45
- The average of income is $73,774
- The average family size is 2
- Credit Card Debt is an average of $1,938 per person
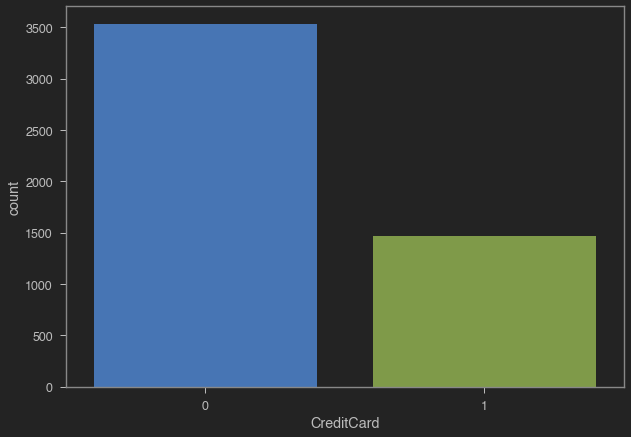
- 29.4% of customers in this dataset have credit card debt
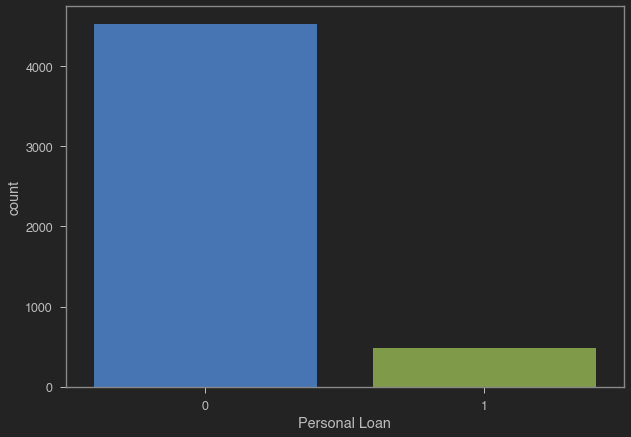
- 9.6% of customers in this dataset have a personal loan
- Percentage of customers who accepted personal loan ~ 9%
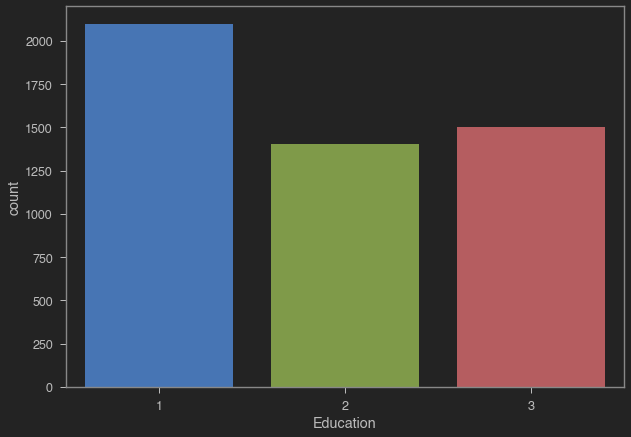
- Most of customer has undergraduate degree
- Uniform distribution between 30-60 years
- Recall that ~29% of customers have credit cards
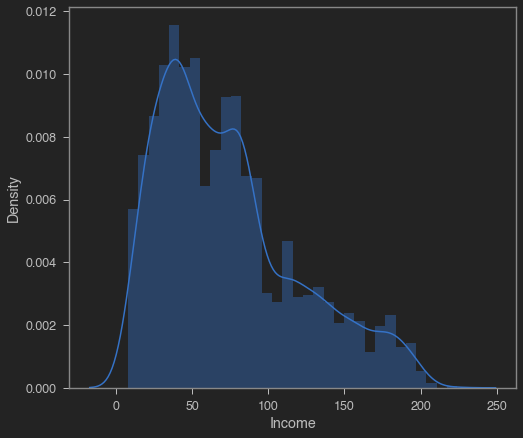
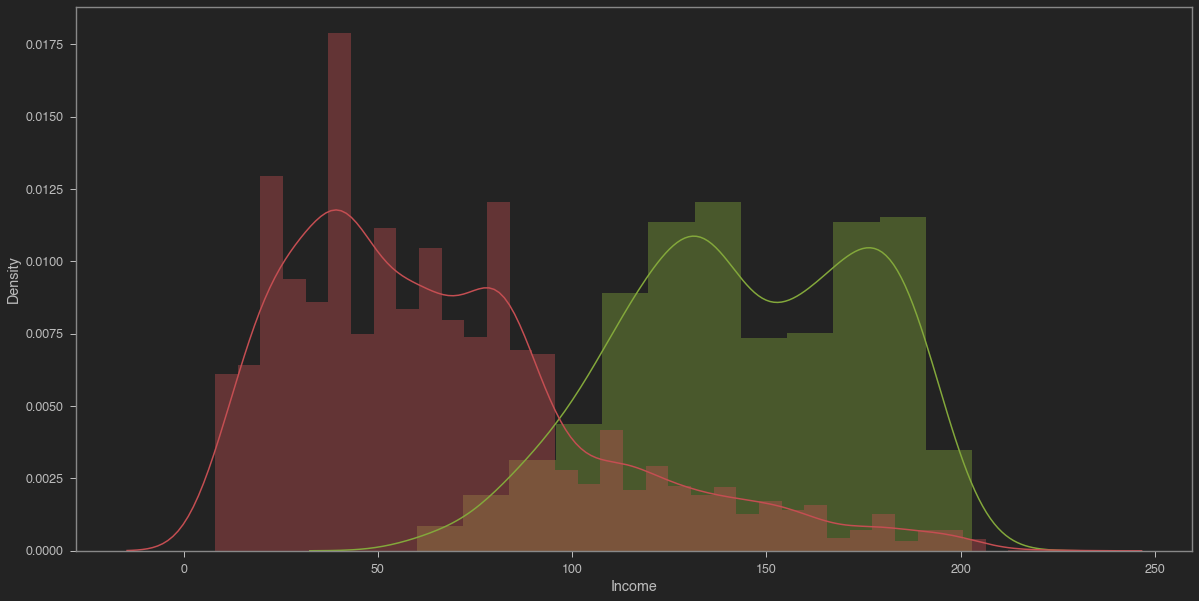
- Most customers have incomes that range between 45K and 60K per year
- Data is skewed with less customers earning above 100K
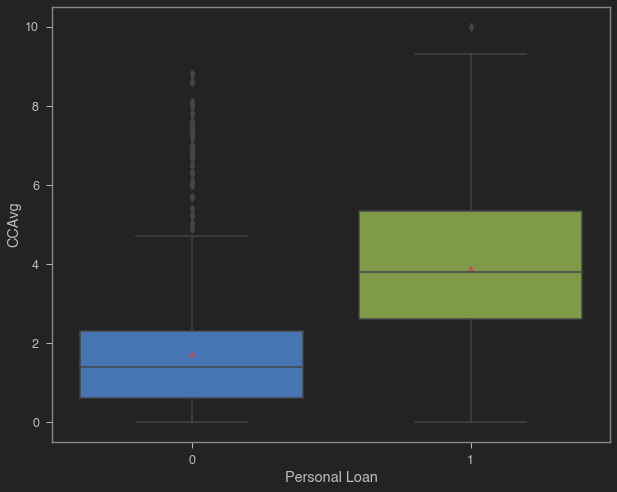
- Mean income of customers who have personal loans is generally high ~ 144K and average CC of 3.9K
- Mean income of customers who have do not have personal loans is generally low ~ 66K and average CC of 1.7K
| Average Credit Card Debt | Average Income |
|---|---|
 |
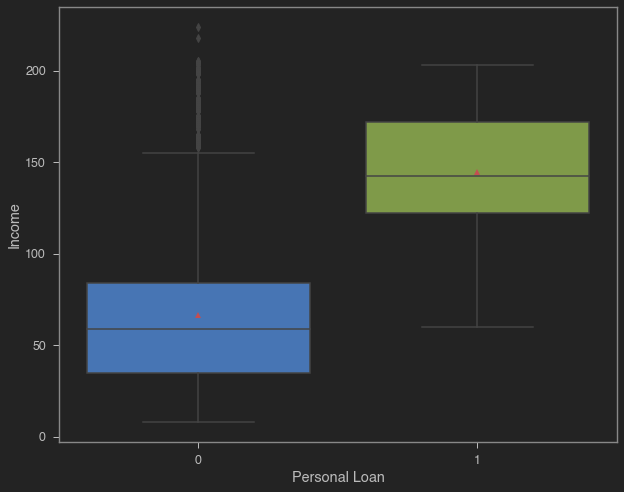 |
- Customers who took personal loans tend to have higher income & debt
| Average Credit Card Debt | Average Income |
|---|---|
 |
 |
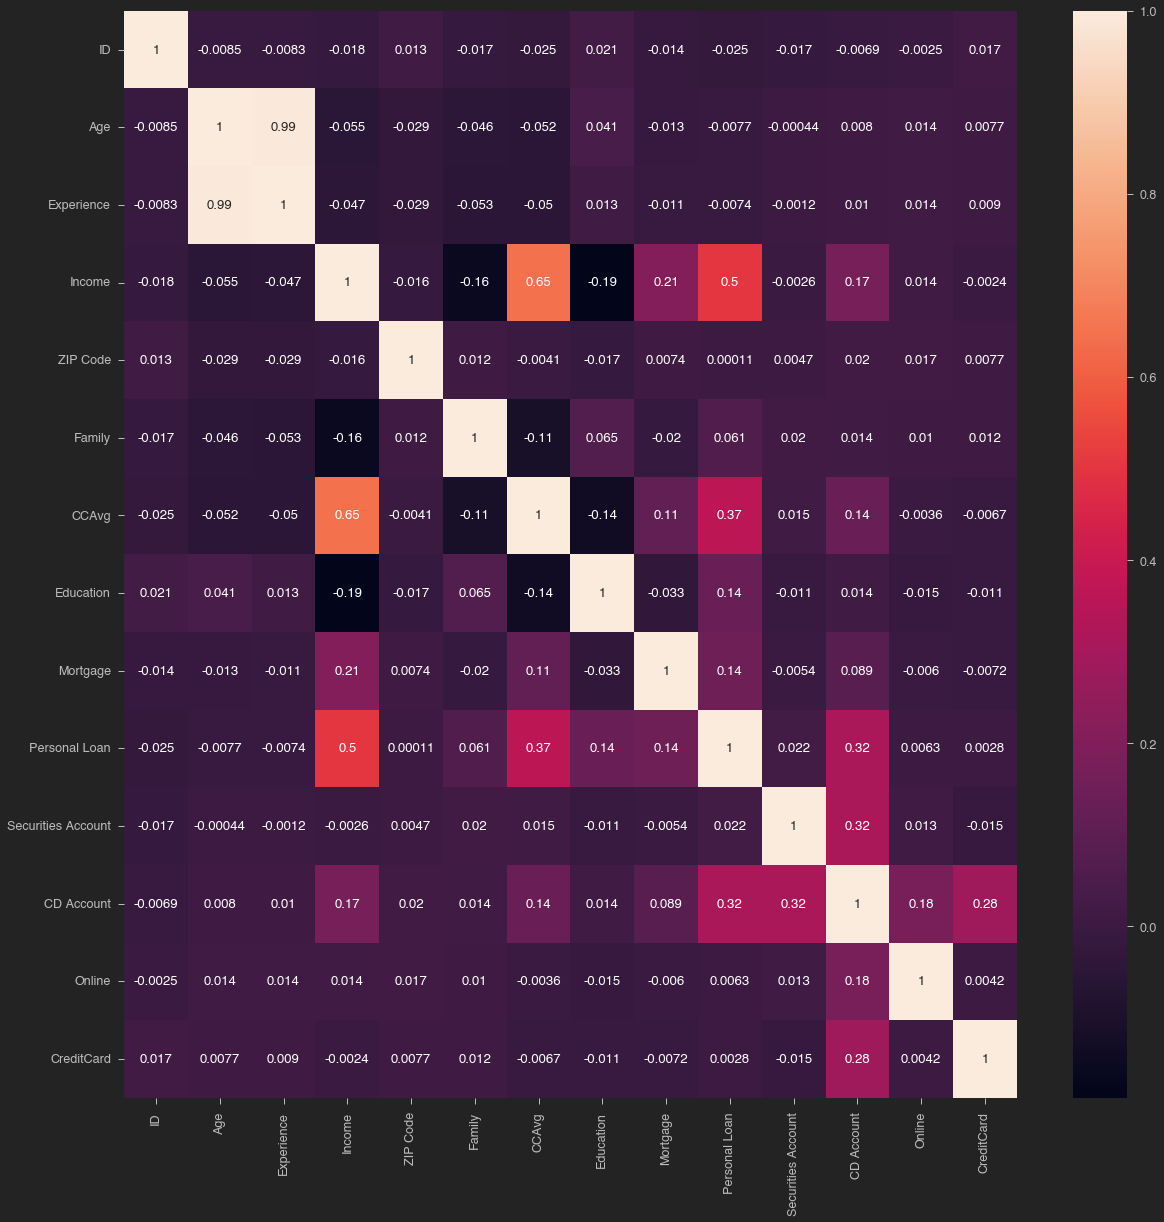
- Stong Positive correlation between experience and age
- Strong positive correlation between CC average and income
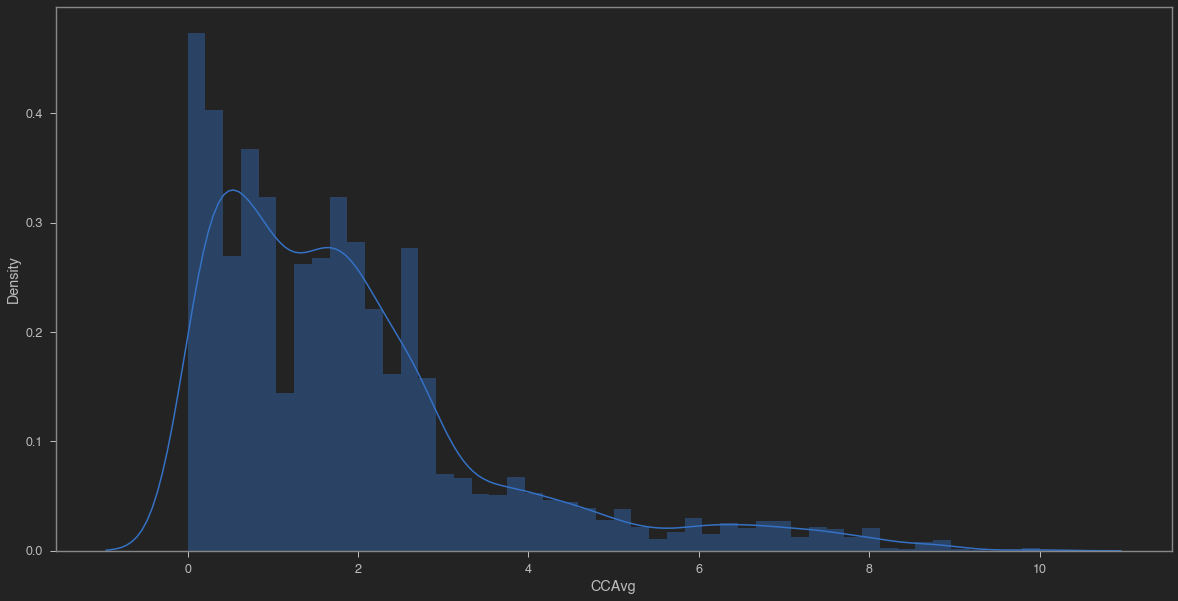
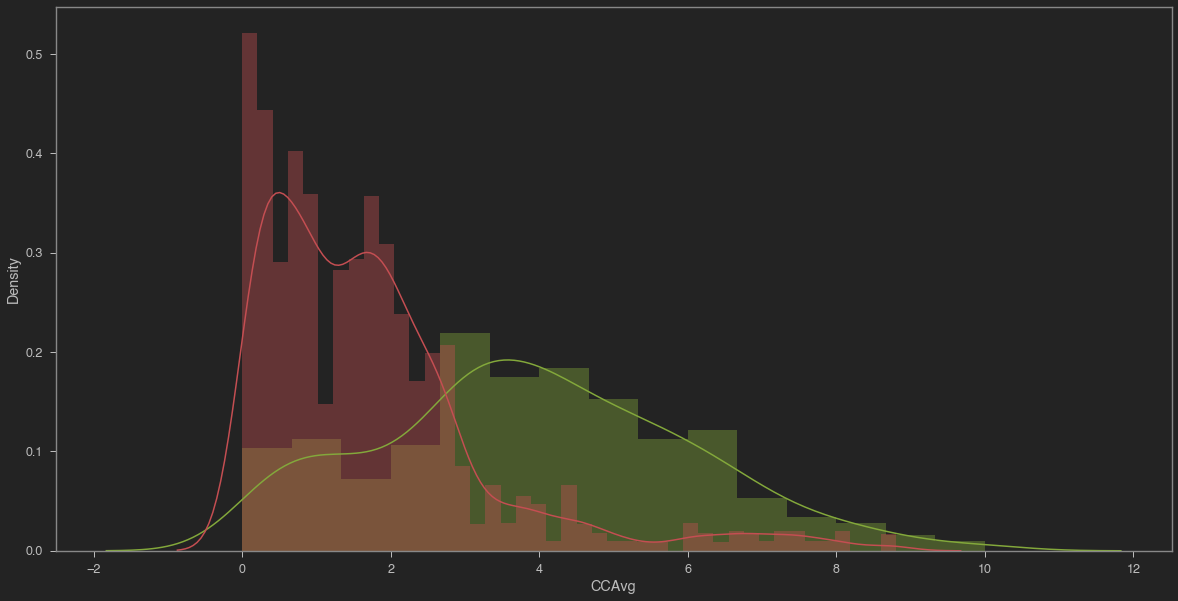
- Most customers Credit card spending is between 0-4K
- Data is positively skewed
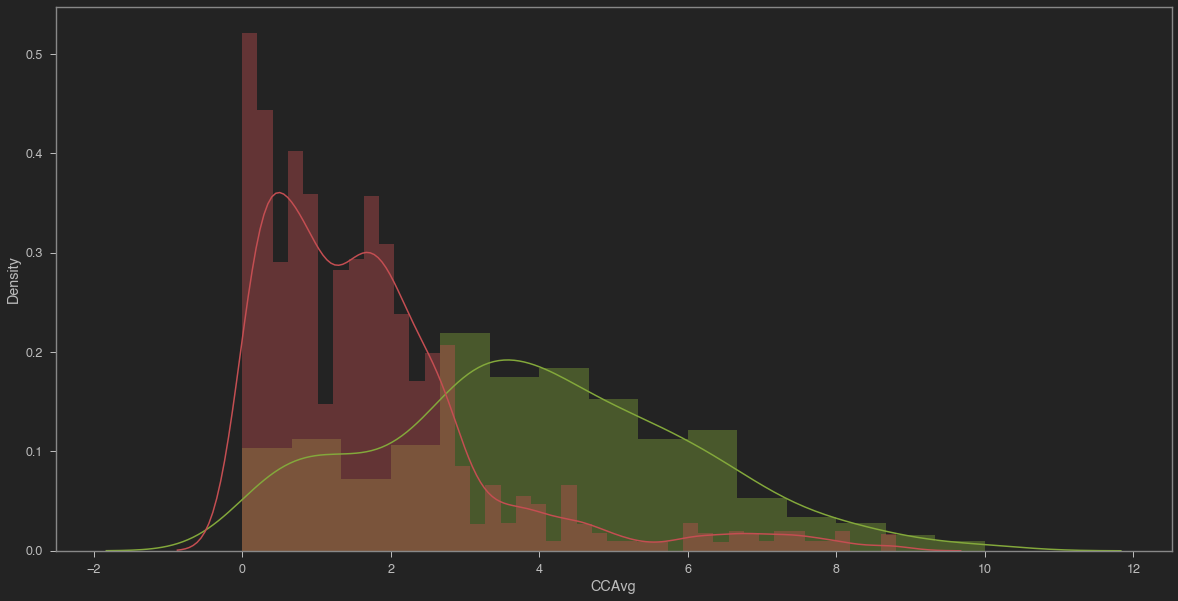
- Customers who have large credit card average tend to have personal loans
- Dataframe X created by dropping the target variable ‘Personal Loan’
- Another dataframe y created contains only target variable 'Personal Loan'
- Apply the one hot encoding method to prepare for the algorithm and get a better prediction
- With one-hot, we convert each categorical value into a new categorical column and assign a binary value of 1 or 0 to those columns.
- Apply the one hot encoding method to prepare for the algorithm and get a better prediction
-
- With one-hot, we convert each categorical value into a new categorical column and assign a binary value of 1 or 0 to those columns.
- This is vital to ensure that all the features that are fed to the artificial neural networks have equal weights.
- We must scale the data before training the model using StandardScaler from Sklearn
-
- Basically, StandardScaler removes the mean and scales each feature or variable to unit variance
- Split the data into testing and training sets
-
- 90% for trainning
-
- 10% for testing
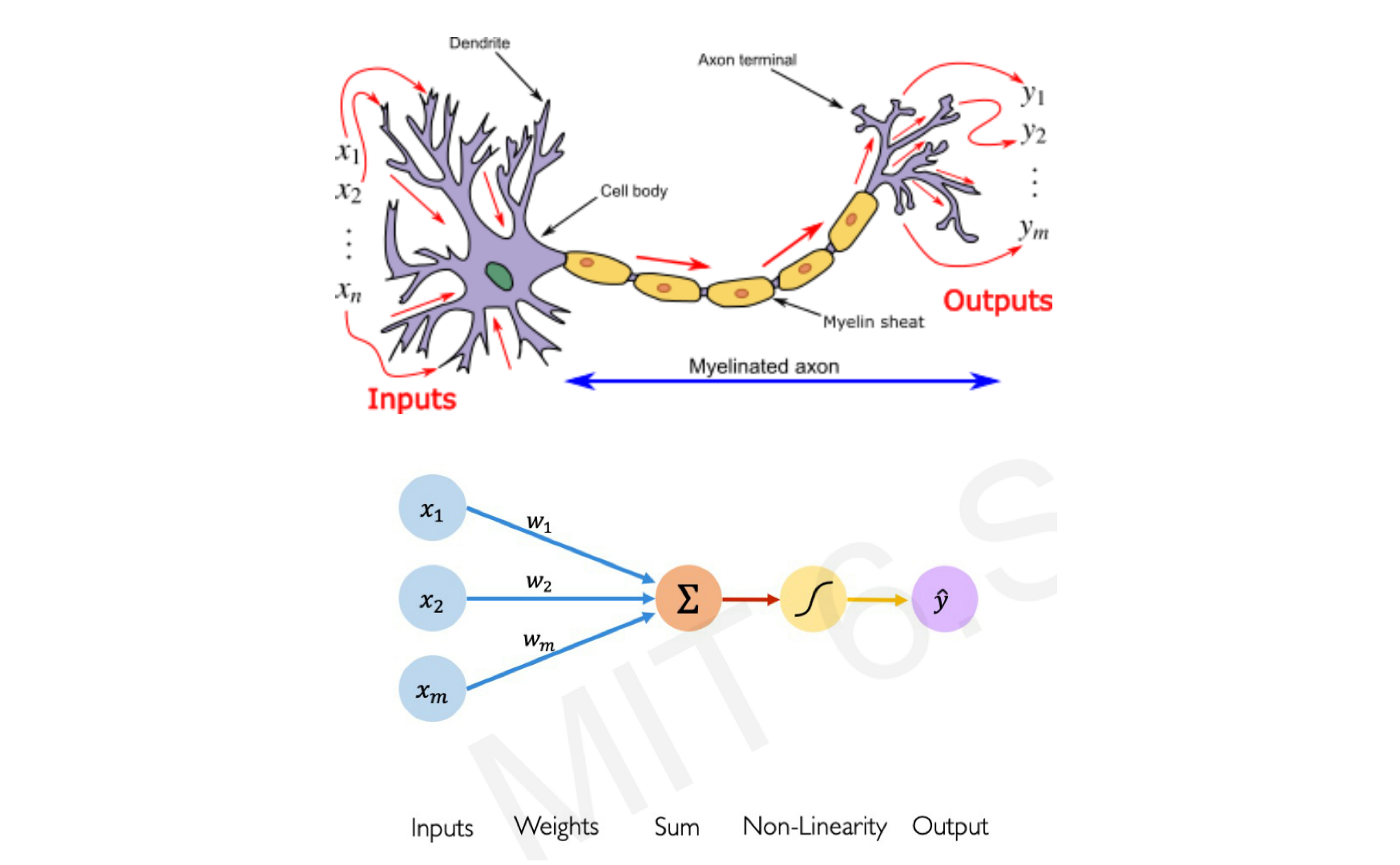
- Using an input channel called dendrites, the neuron collects signals, processes them in its nucleus, and then generates an output in the form of long thin branches called axons.
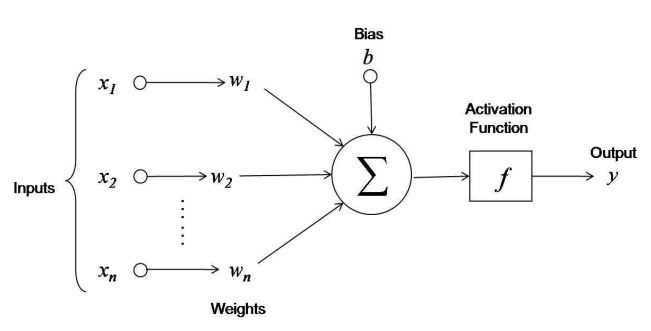
- Bias allows to shift the activation function curve up or down.
- Number of adjustable parameters = 4 (3 weights and 1 bias).
- Activation function F.
- Inputs X, arrive through the preconnected path
- Input is modeled using real weights W. The weights are usually randomly selected.
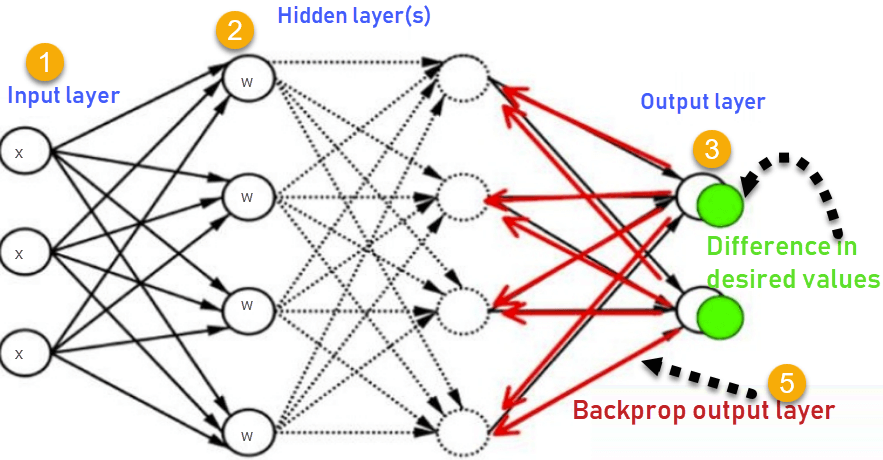
- Calculate the output for every neuron from the input layer, to the hidden layers, to the output layer.
- Calculate the error in the outputs
- Compute the gradient to change the weight: Travel back from the output layer to the hidden layer to adjust the weights such that the error is decreased.
- Keep repeating the process until the desired output is achieved (the loss function is stable: Optimization done!)
| ANN Training Process | Error Performance Measure vs Epoch of Times |
|---|---|
 |
 |
- Gradient descent is an optimization algorithm used to obtain the optimized network weight and bias values
- It works by iteratively trying to minimize the const function
- It works by calculating the gradient of the cost function and moving in the negative direction until the local/global minimum is achieved
- If the positive of the gradient is taken, local/global maximum is achieved
Learning Rate
- The size of the steps taken are called the learning rate
- The learning rate increases, the area covered in the search space will increase so we might reach global minimum faster
- However, we can overshoot the target
- For small learning rates, training will take much longer to reach optimized weight values

