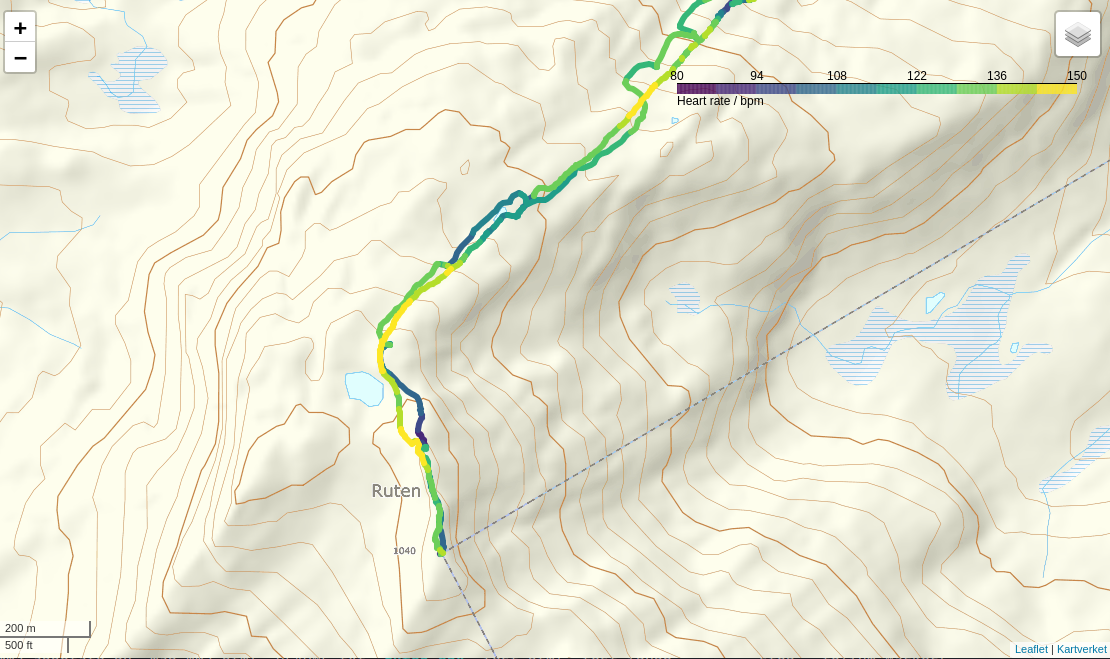
gpxplotter is a Python package for reading gpx files and creating simple predefined plots using matplotlib and maps using folium.
Please see https://gpxplotter.readthedocs.io/en/latest/ for the latest documentation and the Binder notebooks for examples.
pip install gpxplotter
Interactive examples can be explored via Binder.
from gpxplotter import read_gpx_file, create_folium_map, add_segment_to_map

the_map = create_folium_map()
for track in read_gpx_file('ruten.gpx'):
    for i, segment in enumerate(track['segments']):
        add_segment_to_map(the_map, segment, color_by='hr')

# To display the map in a Jupyter notebook:
the_mapPlease see the gallery in the documentation for further examples.
