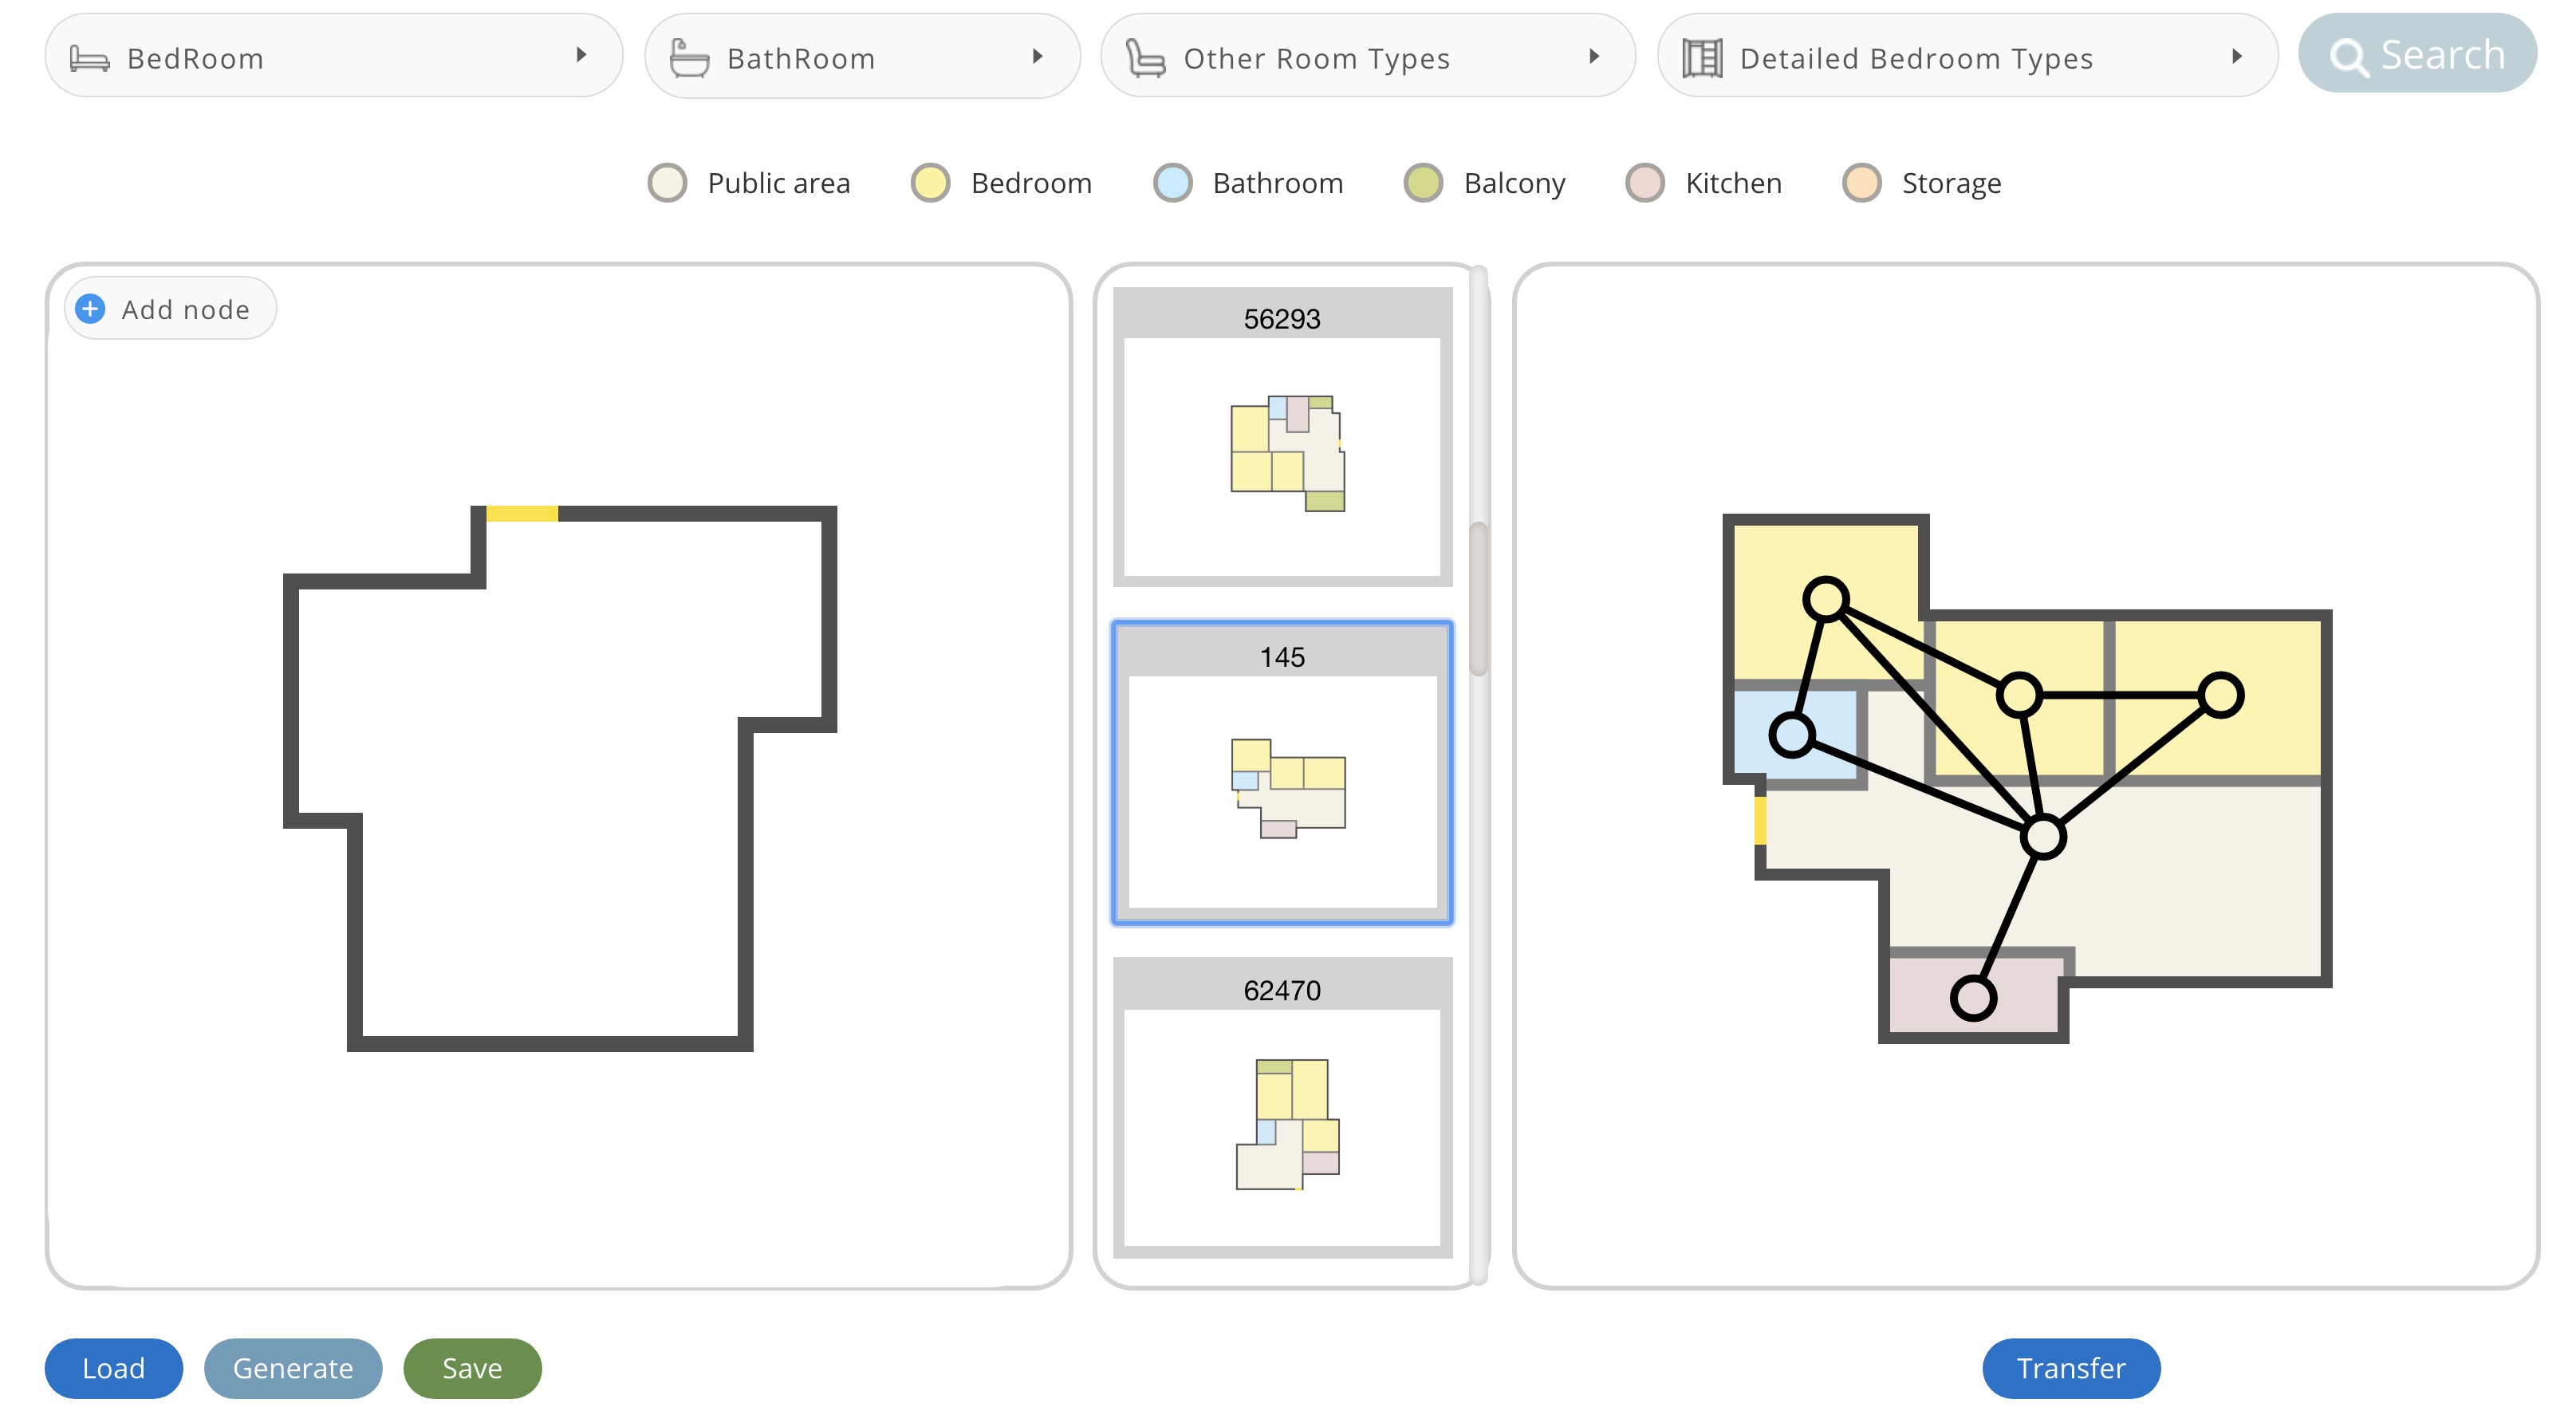
An interactive interface, where the user can edit the retrieved graph and adapt it as needed. The user can add or delete room nodes and/or adjacency edges, or move nodes around to change the layout.
Ruizhen Hu, Zeyu Huang, Yuhan Tang, Oliver Van kaick, Hao Zhang, Hui Huang
SIGGRAPH 2020
We introduce a learning framework for automated floorplan generation which combines generative modeling using deep neural networks and userin- the-loop designs to enable human users to provide sparse design constraints. Such constraints are represented by a layout graph. The core component of our learning framework is a deep neural network, Graph2Plan, which converts a layout graph, along with a building boundary, into a floorplan that fulfills both the layout and boundary constraints. Given an input building boundary, we allow a user to specify room counts and other layout constraints, which are used to retrieve a set of floorplans, with their associated layout graphs, from a database. For each retrieved layout graph, along with the input boundary, Graph2Plan first generates a corresponding raster floorplan image, and then a refined set of boxes representing the rooms. Graph2Plan is trained on RPLAN, a large-scale dataset consisting of 80K annotated floorplans. The network is mainly based on convolutional processing over both the layout graph, via a graph neural network (GNN), and the input building boundary, as well as the raster floorplan images, via conventional image convolution. We demonstrate the quality and versatility of our floorplan generation framework in terms of its ability to cater to different user inputs.We conduct both qualitative and quantitative evaluations, ablation studies, and comparisons with state-of-the-art approaches.
If you have any questions or find any bugs, please contact us: Ruizhen Hu(ruizhen.hu@gmail.com), Zeyu Huang(vcchzy@gmail.com), Yuhan Tang(yuhantang55@gmail.com)
This implementation requires the following dependencies (tested on Window 10):
-
Conda
-
Python 3.7
conda create -n g2p_app python==3.7
conda activate g2p_app
-
You can quickly install/update these dependencies by running the following:
conda install django opencv scipy pandas shapely
conda install pytorch==1.3.1 torchvision -c pytorch
Note: there is a fatal error when using Matlab and pytorch<1.5.0 together on Linux. Please install the latest pytorch 1.5.0+ to use the interface and run post processing.
-
Matlab Python API (Matlab 2019a+ for python 3.7): Find the file "setup.py" in
<PATH_TO_MATLAB>/<VERSION>/extern/engines/python/and runpython setup.py install
-
Download Data: http://vcc.tech/file/upload_file/Data/G2P/Data.7z
unzip the data to this repository
The upload boundary in the interface is under the folder Interface\static\Data\Img\
Note: Place the unzipped data in a folder with the same file name as the project code.
-
Run project:
python manage.py runserver 0.0.0.0:8000
-
Open browser: http://127.0.0.1:8000/home
Create a new environment for training.
conda create -n g2p_train python==3.7
conda activate g2p_train
conda install django opencv scipy pandas
conda install pytorch==1.3.1 torchvision==0.4.2 -c pytorch
pip install tqdm tensorboardX pytorch-ignite==0.2.1Data format
After getting the data introduced in the Interface part, you can find a compact dataset in Network/data.mat. It is extracted from RPLAN using the toolbox.
It can be read by Matlab via load('data.mat','data') or ptyhon via
import scipy.io as sio
data = sio.io.loadmat('data.mat', squeeze_me=True, struct_as_record=False)['data']
print(len(data)) # a data list
Each one of the data item has following fields
data_item
    - name: file name in RPLAN dataset
    - boundary: (x,y,dir,isNew), first two point indicate the front door
    - order: room order for visualization
    - rType: room categories
    - rBoundary: (x,y), boundary points for each room
    - gtBox: (y0,x0,y1,x1), left-top(in) and right-bottom(out) corner of a room, extracted directly from the RPLAN dataset
    - gtBoxNew: (x0,y0,x1,y1), extracted after filling the gap between rooms
    - rEdge: (u,v,r), room indices and relative position(u relative to v)
Split data for training
Run the split script to get train/valid/test split of the data in Network/data
python split.pyRun the trainning script and the experiment logs and outputs are saved in experiment (created automatically).
# train + valid
python train.py
# testing evaluation
python train.py --skip_train 1 The final output of the network is a raster floorplan image and one bounding box for each room (the refined one). An issue that may occur with the output boxes is that they may not be well-aligned and some boxes may overlap in certain regions. So we need some post processing.
The requirements of post processing are the same with the Interface part. Matlab is required to align room bounding boxes with the floorplan boundary.
Change the model_path to the path of trained model and dataset_path to the test split of the dataset in PostProcessing/test.py, and run
python test.py
A floorplan image test.png will be generated.
Get the data introduced in the Interface part, and run
python test_interface_data.py
A floorplan image test_interface_data.png will be generated.
Some source files are borrowed from:
- sg2im: https://github.com/google/sg2im
- scene generation: https://github.com/ashual/scene_generation
Original RPLAN dataset: http://staff.ustc.edu.cn/~fuxm/projects/DeepLayout/index.html

