How to collect metrics from Spring Boot application with micrometer prometheus and grafana full guide
Preconditions:
- Maven, but you can adapt it for gradle too.
- Docker and docker-compose, prometheus and grafana will be used as containers.
- Spring boot 2 and higher by default, but it was backported for 1.3-1.5 with dependencies.
- IDEA or any different ide
Since Spring boot 2 Micrometer is default metric collector. And it is simple to expose metrics of application through new actuator approach. It is neccesary to just add metric provider and read them. Here we will use Prometheus as metric collector.
I will use sample application as an example. All the source code will be available on github.
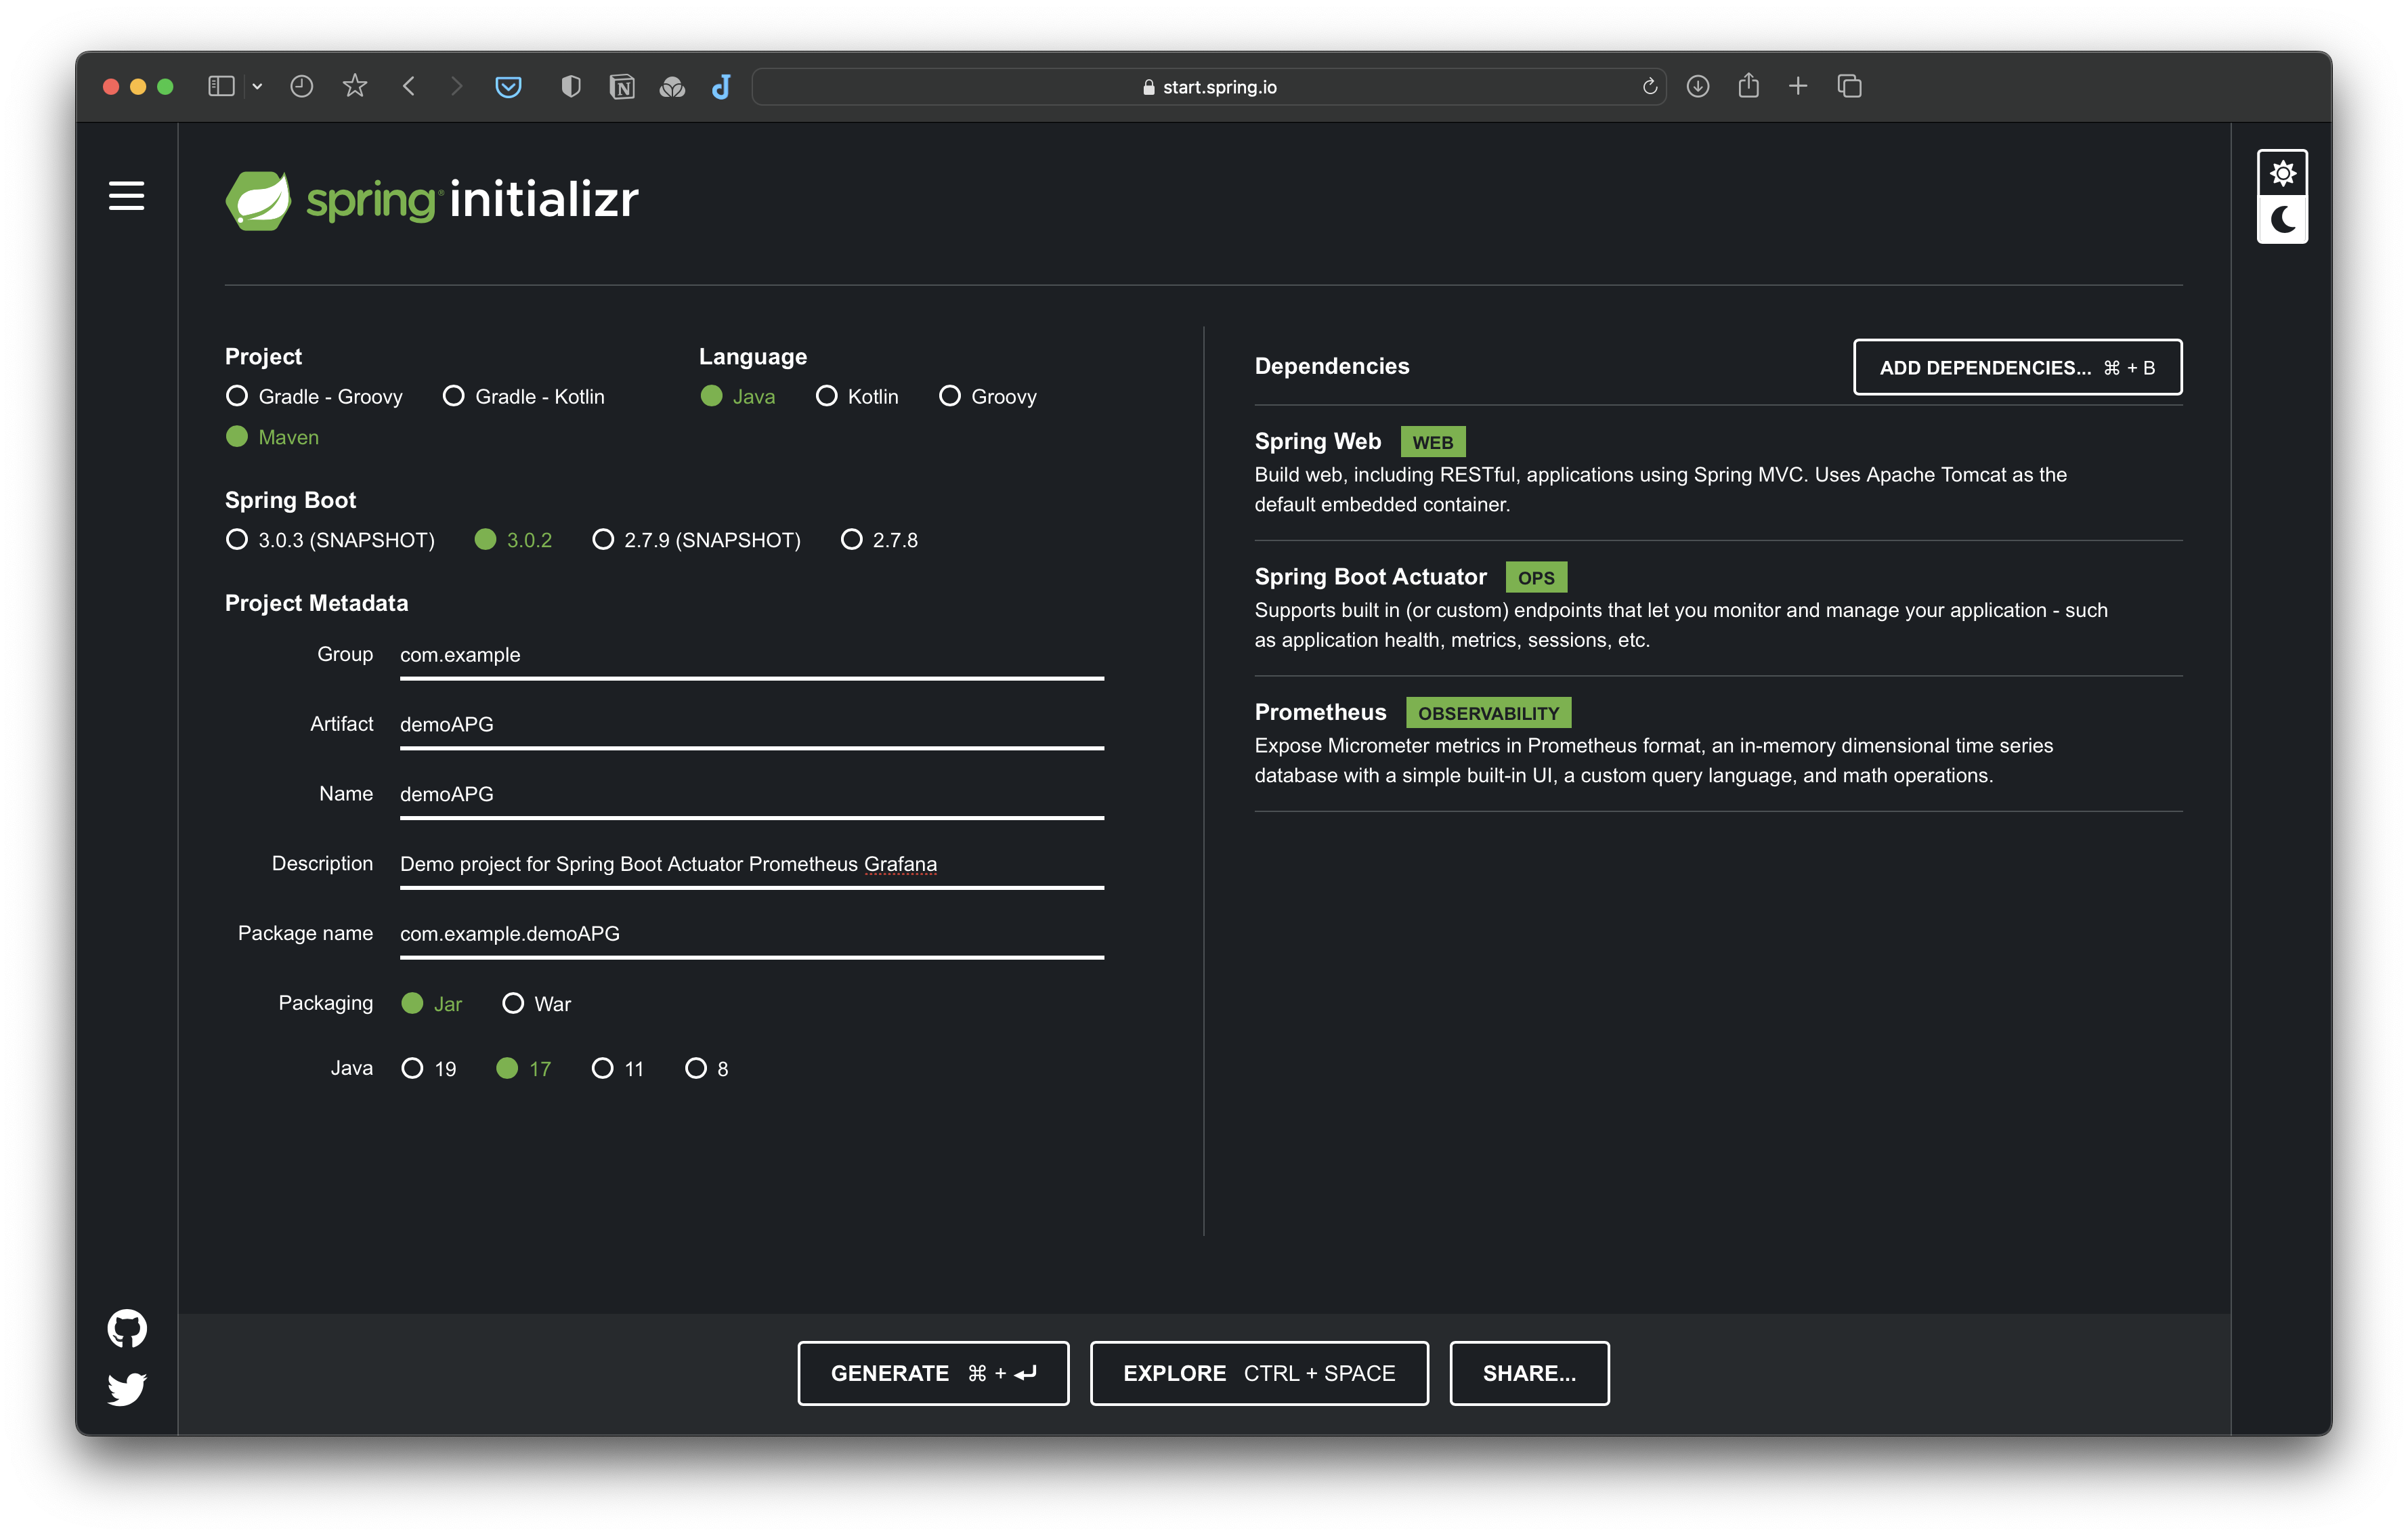
Init spring boot 2 via spring initializr [optional]
 Sample application can be created via spring initializr and it required to add dependencies for start.
        <dependency>
            <groupId>org.springframework.boot</groupId>
            <artifactId>spring-boot-starter-web</artifactId>
        </dependency>
Setup actuator
Spring boot provides a mechanism which is used for service of application. Firstly, add the dependency for actuator
        <dependency>
            <groupId>org.springframework.boot</groupId>
            <artifactId>spring-boot-starter-actuator</artifactId>
        </dependency>
By default actuator is available on port=8080 uri=/actuator"
So, sample app actuator is available on uri=localhost:8080/actuator
We can visit this page and see sample actuator json answer. Now actuator is working and we are ready to supply metrics.
{
   "_links":{
      "self":{
         "href":"http://localhost:8080/actuator",
         "templated":false
      },
      "health-path":{
         "href":"http://localhost:8080/actuator/health/{*path}",
         "templated":true
      },
      "health":{
         "href":"http://localhost:8080/actuator/health",
         "templated":false
      },
      "info":{
         "href":"http://localhost:8080/actuator/info",
         "templated":false
      }
   }
}
Metrics collection enable
Micrometer is included default distribution, so you only need to metric export to prometheus, just add a dependency for it.
        <dependency>
            <groupId>io.micrometer</groupId>
            <artifactId>micrometer-registry-prometheus</artifactId>
        </dependency>
Next we configure application.yml to provide metrics from application.
By default prometheus endpoint is disabled and we need to activate it.
Here is sample config.
management:
  endpoints:
    web:
      exposure:
        include: health,prometheus
  metrics:
    export:
      prometheus:
        enabled: true
    distribution:
      percentiles-histogram:
        "[http.server.requests]": true
Or .properties:
management.endpoints.web.exposure.include=health,prometheus
metrics.export.prometheus.enabled=true
metrics.distribution.percentiles-histogram.[http.server.requests]=true
I opened two endpoints health and prometheus, moreover enabled metrics collection for prometheus and distribution.percentiles-histogram.http.server.requests will watch for endpoint performance and response codes. Also micrometer by default shows jvm metrics, so if we now launch application at http://localhost:8080/actuator/prometheus we will see jvm metrics and request ditribution (It will be printed after first api request).
jvm_memory_used_bytes{area="nonheap",id="Compressed Class Space",} 5166496.0
jvm_memory_used_bytes{area="nonheap",id="CodeHeap 'non-profiled nmethods'",} 6184704.0
# HELP tomcat_sessions_active_current_sessions
# TYPE tomcat_sessions_active_current_sessions gauge
tomcat_sessions_active_current_sessions 0.0
# HELP jvm_buffer_memory_used_bytes An estimate of the memory that the Java virtual machine is using for this buffer pool
# TYPE jvm_buffer_memory_used_bytes gauge
jvm_buffer_memory_used_bytes{id="mapped",} 0.0
jvm_buffer_memory_used_bytes{id="direct",} 16384.0
# HELP process_start_time_seconds Start time of the process since unix epoch.
# TYPE process_start_time_seconds gauge
process_start_time_seconds 1.615646733726E9
# HELP system_cpu_usage The "recent cpu usage" for the whole system
# TYPE system_cpu_usage gauge
system_cpu_usage 0.0
# HELP process_cpu_usage The "recent cpu usage" for the Java Virtual Machine process
# TYPE process_cpu_usage gauge
process_cpu_usage 0.0
# HELP jvm_classes_unloaded_classes_total The total number of classes unloaded since the Java virtual machine has started execution
# TYPE jvm_classes_unloaded_classes_total counter
jvm_classes_unloaded_classes_total 0.0
# HELP jvm_gc_max_data_size_bytes Max size of long-lived heap memory pool
# TYPE jvm_gc_max_data_size_bytes gauge
jvm_gc_max_data_size_bytes 4.294967296E9
# HELP http_server_requests_seconds
# TYPE http_server_requests_seconds histogram
http_server_requests_seconds_bucket{exception="None",method="GET",outcome="SUCCESS",status="200",uri="/actuator",le="0.002446676",} 0.0
http_server_requests_seconds_bucket{exception="None",method="GET",outcome="SUCCESS",status="200",uri="/actuator",le="0.002796201",} 0.0
http_server_requests_seconds_bucket{exception="None",method="GET",outcome="SUCCESS",status="200",uri="/actuator",le="0.003145726",} 0.0
http_server_requests_seconds_bucket{exception="None",method="GET",outcome="SUCCESS",status="200",uri="/actuator",le="0.003495251",} 0.0
http_server_requests_seconds_bucket{exception="None",method="GET",outcome="SUCCESS",status="200",uri="/actuator",le="0.003844776",} 0.0
Monitoring environment
Sample docker-compose.yml for prometheus and grafana.
version: '3.7'

services:
  grafana:
    build: './config/grafana'
    ports:
      - 3000:3000
    volumes:
      - ./grafana:/var/lib/grafana
    environment:
      - GF_SECURITY_ADMIN_USER=admin
      - GF_SECURITY_ADMIN_PASSWORD=admin
    networks:
      monitoring:
        aliases:
          - grafana
  prometheus:
    image: prom/prometheus
    ports:
      - 9090:9090
    volumes:
      - ./config/prometheus.yml:/etc/prometheus/prometheus.yml
      - ./prometheus:/prometheus
    networks:
      monitoring:
        aliases:
          - prometheus
networks:
  monitoring:
As you can see grafana container is builded. It is grafana bug with preconfigured dashboards. I preconfigured sample dashboards for grafana. See more in source repo
Make sure to configure prometheus.yml for your url.
Sample
scrape_configs:
  - job_name: 'sample_monitoring'
    scrape_interval: 5s
    metrics_path: '/actuator/prometheus'
    static_configs:
      - targets: ['host.docker.internal:8080']
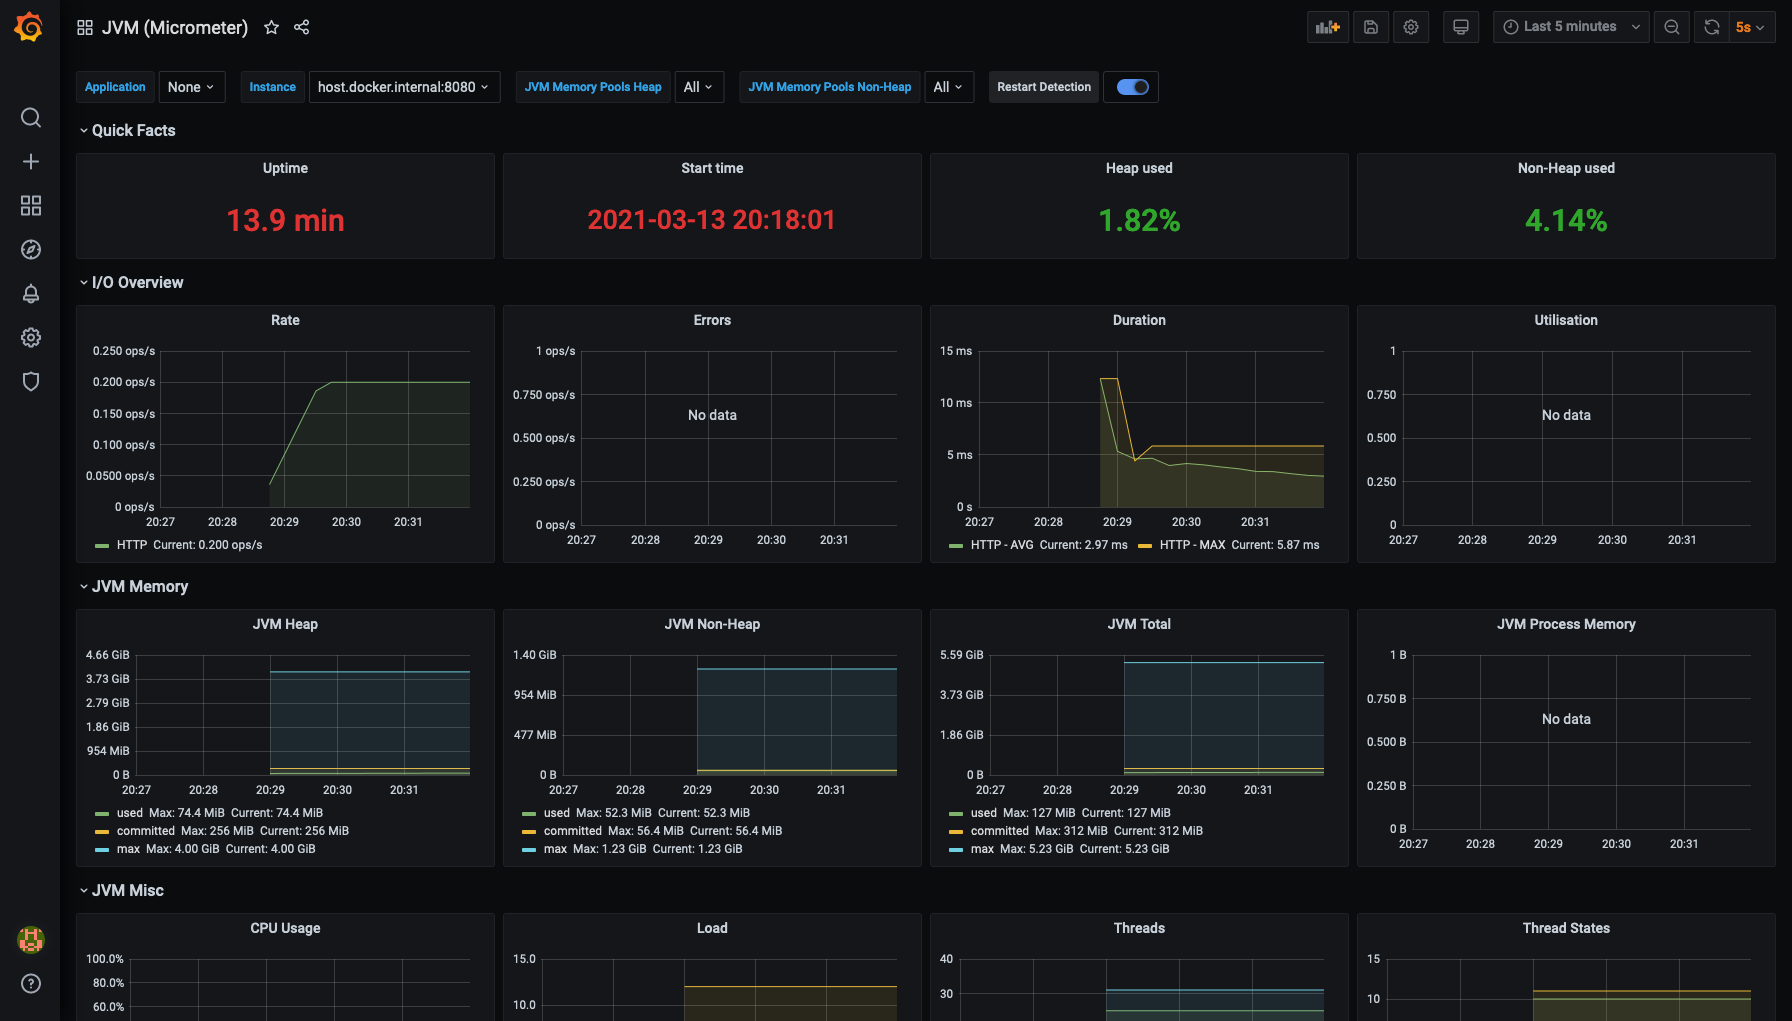
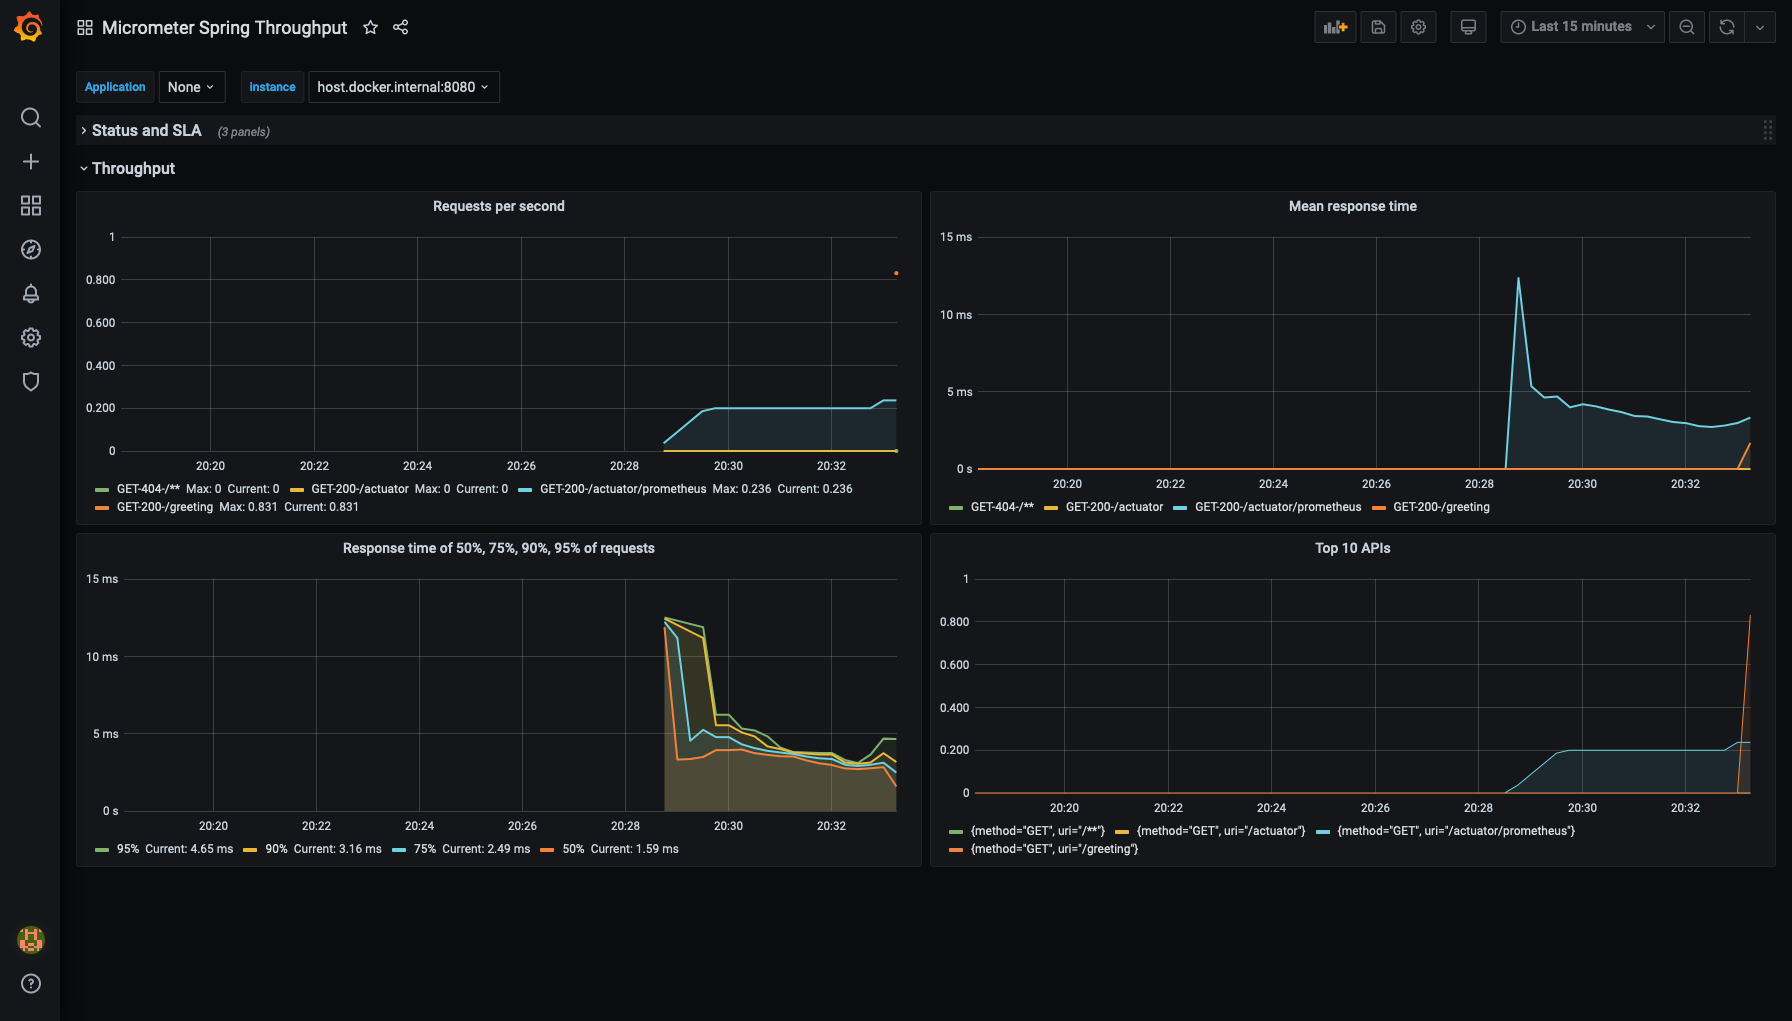
I have prepared two diffirent dashboards
- JVM
- Responses

