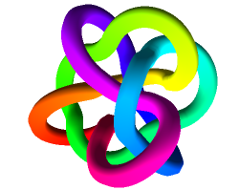
Python (and optional Cython) modules for detecting and measuring knotting and linking. pyknotid can analyse space-curves, i.e. sets of points in three-dimensions, or can parse standard topological representations of knot diagrams.
pyknotid is released under the MIT license.
A graphical interface to some of these tools is available online at Knot ID.
pyknotid was originally developed as part of the Leverhulme Trust Research Programme Grant RP2013-K-009: Scientific Properties of Complex Knots (SPOCK), a collaboration between the University of Bristol and Durham University in the UK. For more information, see the SPOCK homepage.
If you use pyknotid in your research, please cite us.
Questions or comments are welcome, please email alexander.taylor@bristol.ac.uk.
pyknotid is documented online at readthedocs.
pyknotid supports both Python 2.7 and Python 3.5+, you can install it with:
$ pip install pyknotid
To try the latest development version, clone this repository and run:
$ python setup.py install
If installing pyknotid without pip, the following dependencies are required:
- cython (not essential, but strongly recommended)
- numpy
- sympy
- peewee
- networkx
- planarity
Most of these are not hard requirements, but some functionality will not be available if they are not present.
In [1]: import pyknotid.spacecurves as sp

In [2]: import pyknotid.make as mk

In [3]: k = sp.Knot(mk.three_twist(num_points=100))

In [4]: k.plot()

In [5]: k.alexander_polynomial(-1)
Finding crossings
i = 0 / 97
7 crossings found

Simplifying: initially 14 crossings
-> 10 crossings after 2 runs
Out[5]: 6.9999999999999991

In [6]: import sympy as sym

In [7]: t = sym.var('t')

In [8]: k.alexander_polynomial(t)
Simplifying: initially 10 crossings
-> 10 crossings after 1 runs
Out[8]: 2/t - 3/t**2 + 2/t**3

In [9]: k.octree_simplify(5)
Run 0 of 5, 100 points remain
Run 1 of 5, 98 points remain
Run 2 of 5, 104 points remain
Run 3 of 5, 92 points remain
Run 4 of 5, 77 points remain

Reduced to 77 points

In [10]: k.plot()