General Utility Plugin for SFDX


$ npm install -g zdware-sfdx
$ sfdx COMMAND
running command...
$ sfdx (-v|--version|version)
zdware-sfdx/0.0.1 linux-x64 node-v12.18.1
$ sfdx --help [COMMAND]
USAGE
  $ sfdx COMMAND
...
sfdx zdware:cleanWorkspace [-f] [--force] [--json] [-u] [--targetusername] [--loglevel trace|debug|info|warn|error|fatal|TRACE|DEBUG|INFO|WARN|ERROR|FATAL]
After confirmation, delete all of the IDEWorkspace records belonging to your user.
Meant to fix this issue: https://help.salesforce.com/articleView?id=000335530&type=1&mode=1
USAGE
  $ sfdx hello:org [-f] [-u <string>] [--json] [--loglevel
  trace|debug|info|warn|error|fatal|TRACE|DEBUG|INFO|WARN|ERROR|FATAL]

OPTIONS
  -f, --force                                                                       delete without confirming.

  -u, --targetusername=targetusername                                               username or alias for the target
                                                                                    org; overrides default target org

  --json                                                                            format output as json

  --loglevel=(trace|debug|info|warn|error|fatal|TRACE|DEBUG|INFO|WARN|ERROR|FATAL)  [default: warn] logging level for
                                                                                    this command invocation

EXAMPLES
  $ sfdx hello:org --targetusername myOrg@example.com --targetdevhubusername devhub@org.com
     Hello world! This is org: MyOrg and I will be around until Tue Mar 20 2018!
     My hub org id is: 00Dxx000000001234

<!-- commandsstop -->
<!-- debugging-your-plugin -->
# Debugging your plugin
We recommend using the Visual Studio Code (VS Code) IDE for your plugin development. Included in the `.vscode` directory of this plugin is a `launch.json` config file, which allows you to attach a debugger to the node process when running your commands.

To debug the `hello:org` command:
1. Start the inspector

If you linked your plugin to the sfdx cli, call your command with the `dev-suspend` switch:
```sh-session
$ sfdx hello:org -u myOrg@example.com --dev-suspend
Alternatively, to call your command using the bin/run script, set the NODE_OPTIONS environment variable to --inspect-brk when starting the debugger:
$ NODE_OPTIONS=--inspect-brk bin/run hello:org -u myOrg@example.com- Set some breakpoints in your command code
- Click on the Debug icon in the Activity Bar on the side of VS Code to open up the Debug view.
- In the upper left hand corner of VS Code, verify that the "Attach to Remote" launch configuration has been chosen.
- Hit the green play button to the left of the "Attach to Remote" launch configuration window. The debugger should now be suspended on the first line of the program.
- Hit the green play button at the top middle of VS Code (this play button will be to the right of the play button that you clicked in step #5).
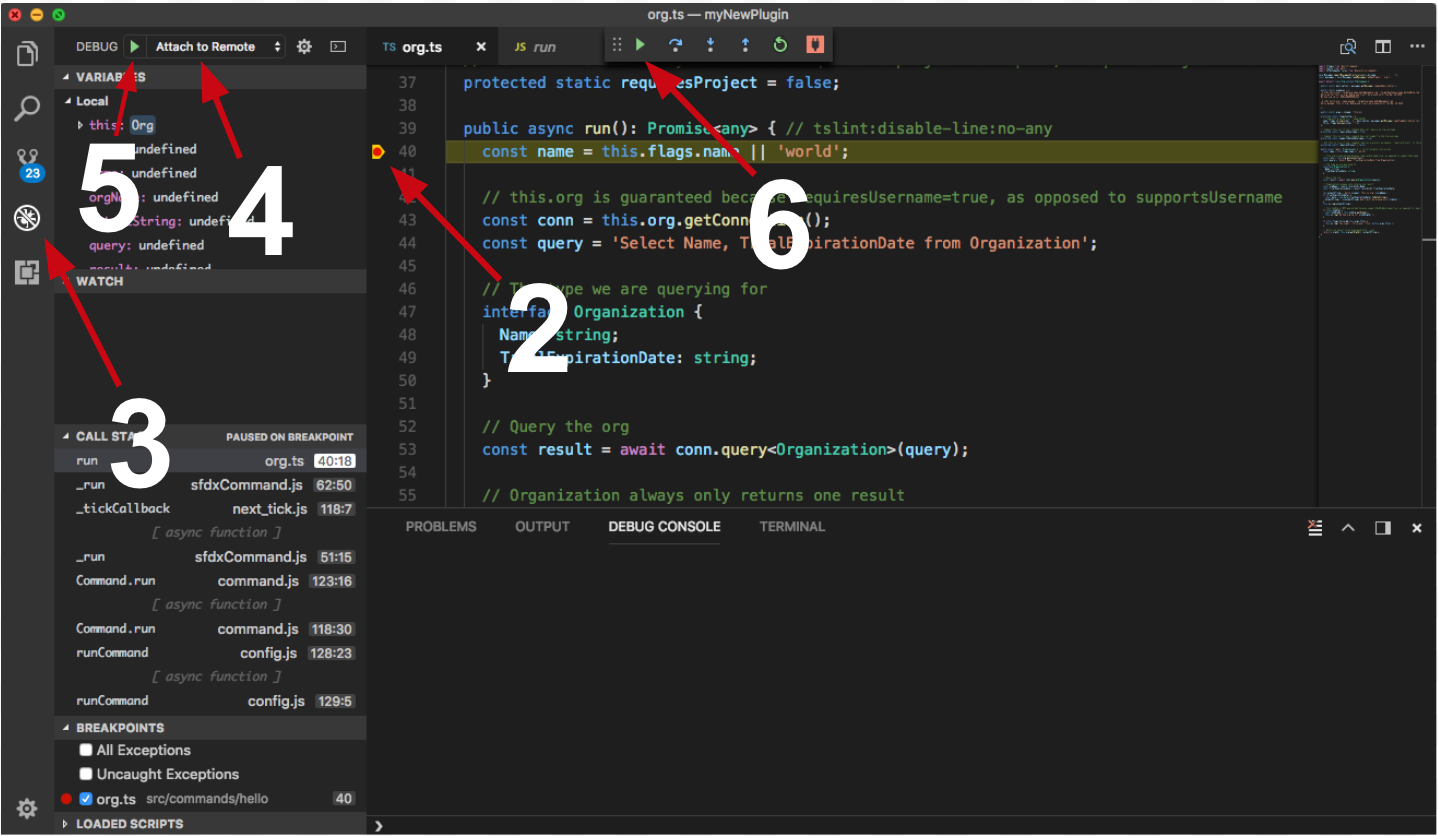
Congrats, you are debugging!
