Extract Data from your Kostal Piko
Logs your Data and acts as a server with live data!
I own a Kostal Piko 5.5
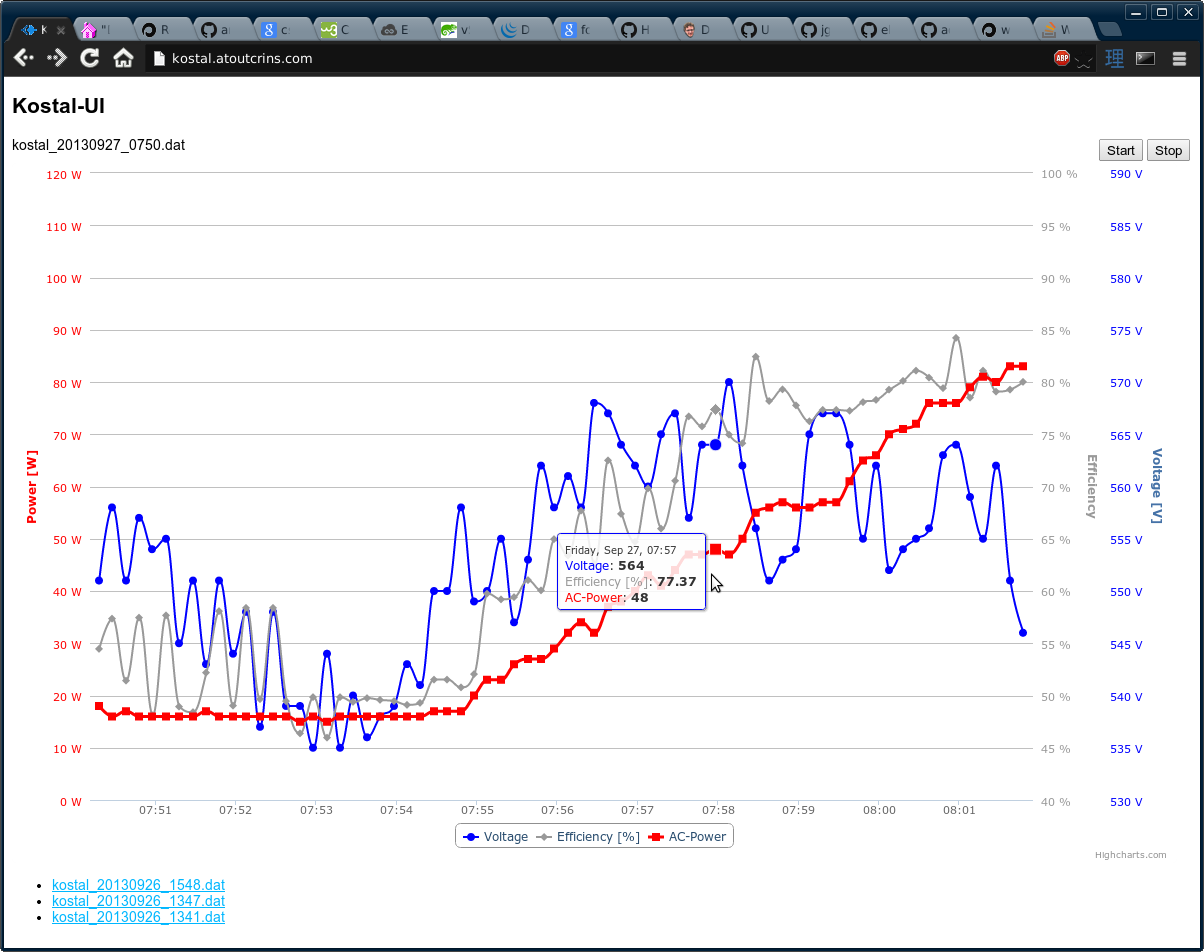
Normal data-loggers only provide data every 5 or 15 minutes without voltage or efficiency information. Since I experience power-drops, when only one solar module is partly shaded I wanted more detailed information (which in my case clearly shows that on after-noon shade after 5:00 pm it really chooses much to high voltages - resulting in losses of to up to 80%)
Do 'npm install kostal-ui' then add jquery and highcharts libs under public/javascripts/external and edit the url on the first line of kostal-ui.js
npm kostal-ui.js
You can start and stop data-logging and view old logs. Hey, it uses sockets, so you can view data-logging life and even simultaneously on different devices ;) It stops automatically, when there is no sunshine any more.
The csv-file are in your 'logs' directory, which can also be used in Libreoffice. Just convert TimeExcel colum to "date with time" and use "Insert Diagramm" to view your data.
Uses Kostal (also available under 'npm install kostal')
