This is a demo of the Dash interactive Python framework developed by Plotly.
Dash abstracts away all of the technologies and protocols required to build an interactive web-based application and is a simple and effective way to bind a user interface around your Python code. To learn more check out our documentation.
First create a virtual environment with conda or venv inside a temp folder, then activate it.
virtualenv venv

# Windows
venv\Scripts\activate
# Or Linux
source venv/bin/activate
Clone the git repo, then install the requirements with pip
git clone https://github.com/plotly/dash-sample-apps
cd dash-sample-apps/apps/dash-oil-and-gas
pip install -r requirements.txt
Run the app
python app.py
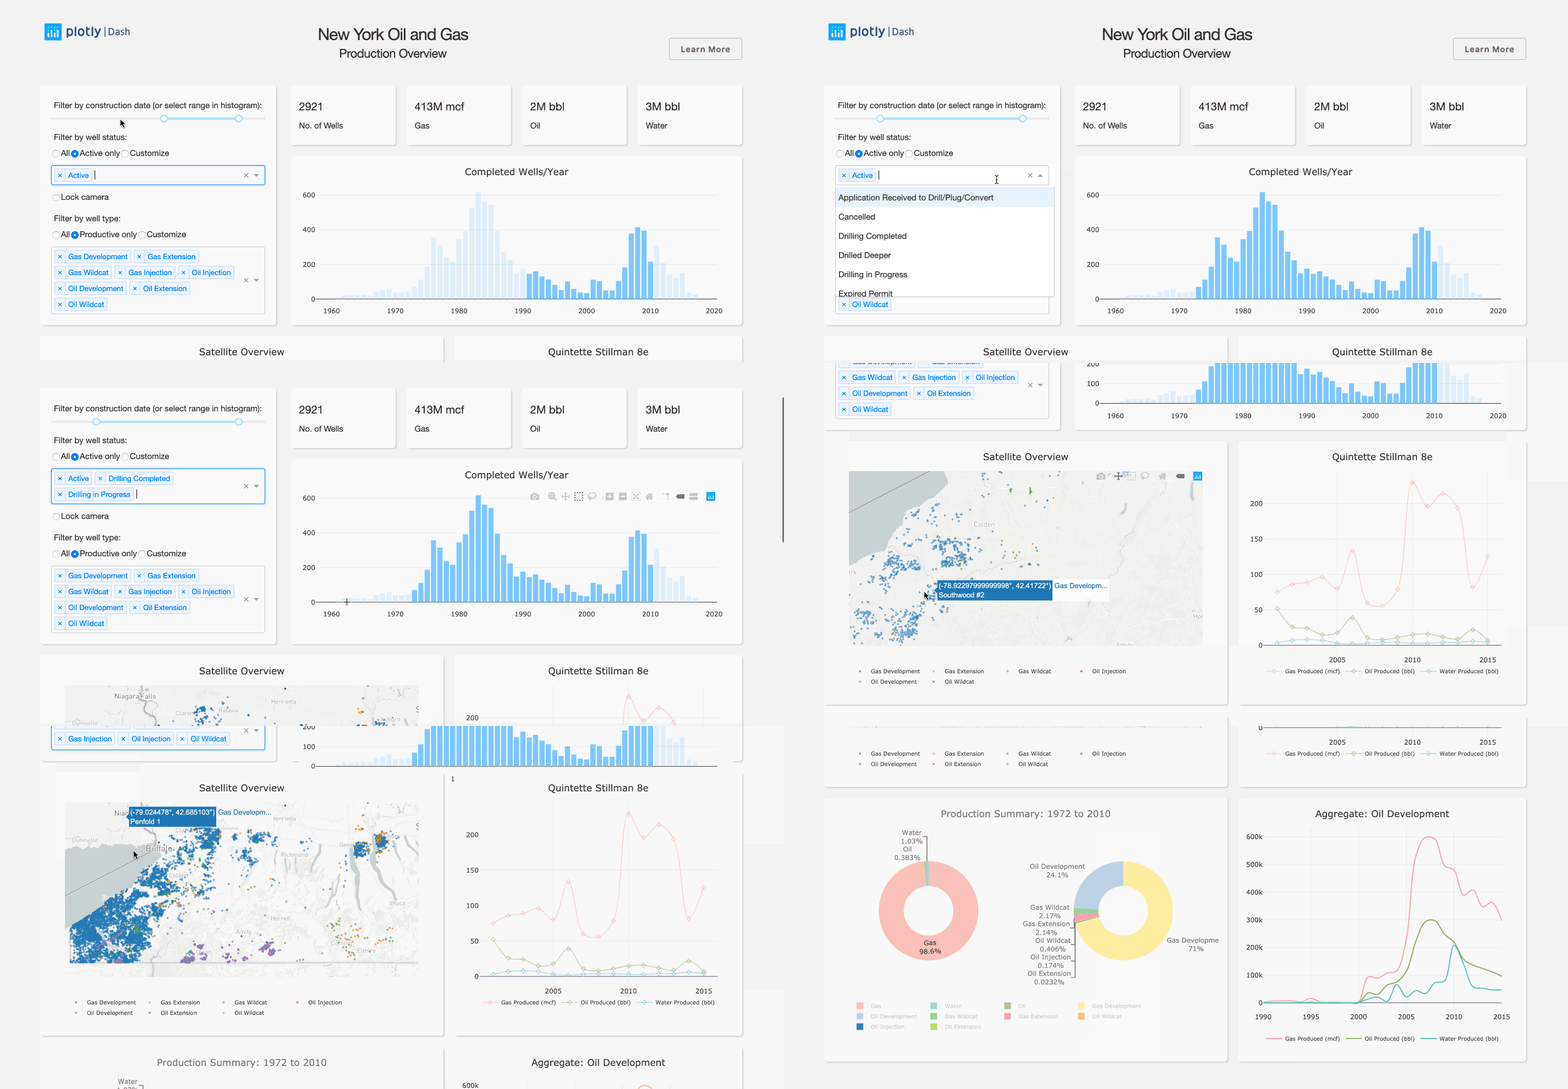
This Dash app displays oil production in western New York. There are filters at the top of the app to update the graphs below. By selecting or hovering over data in one plot will update the other plots ('cross-filtering').
- Dash - Main server and interactive components
- Plotly Python - Used to create the interactive plots
The following are screenshots for the app in this repo:


