D3js is a great tool to visualize complex data in a dynamic way. But how can the visualization be part of the natural workflow?
Creating new reactive elements through the integration of Shiny with d3js objects allows us to solve this problem.
Through Shiny we let the server observe the d3 collapsible tree library and its real-time layout. The data transferred back to Shiny can be mapped to a series of logial expressions to create reactive filters. This allows for complex data structures, such as heirarchal simulations, complex design of clinical trials and results from polycompartmental structural models to be visually represented and filtered in a reactive manner through an intuitive and simple tool.
- New shiny observer 'activeNode' added to return meta data of last clicked node. The meta data requested can be inputed in the d3tree call in the
activeReturnargument. (full example app see here)
Server Side
  observeEvent(input$d3_update,{
    activeNode<-input$d3_update$.activeNode
    if(!is.null(activeNode)) network$click <- jsonlite::fromJSON(activeNode)
  })

  observeEvent(network$click,{
    output$clickView<-renderTable({
      as.data.frame(network$click)
    },caption='Last Clicked Node',caption.placement='top')
  })
UI Side
tableOutput("clickView")
- give option to grow a horizontal tree (default) and a vertical tree
    #horizontal(default)
    d3tree(list(root = df2tree(rootname = 'Titanic',struct = as.data.frame(Titanic),toolTip = letters[1:5]),
    layout = 'collapse'))

    #vertical
    d3tree(list(root = df2tree(rootname = 'Titanic',struct = as.data.frame(Titanic),toolTip = letters[1:5]),
    layout = 'collapse'),direction = 'v')
Running the App through Github
#check to see if libraries need to be installed
libs=c("rstan","shiny","shinyAce","RCurl","reshape2","stringr","DT","plyr","dplyr")
x=sapply(libs,function(x)if(!require(x,character.only = T,warn.conflicts = F,quietly = T)) install.packages(x));rm(x,libs)

#run App
#shiny::runGitHub("metrumresearchgroup/d3Tree")
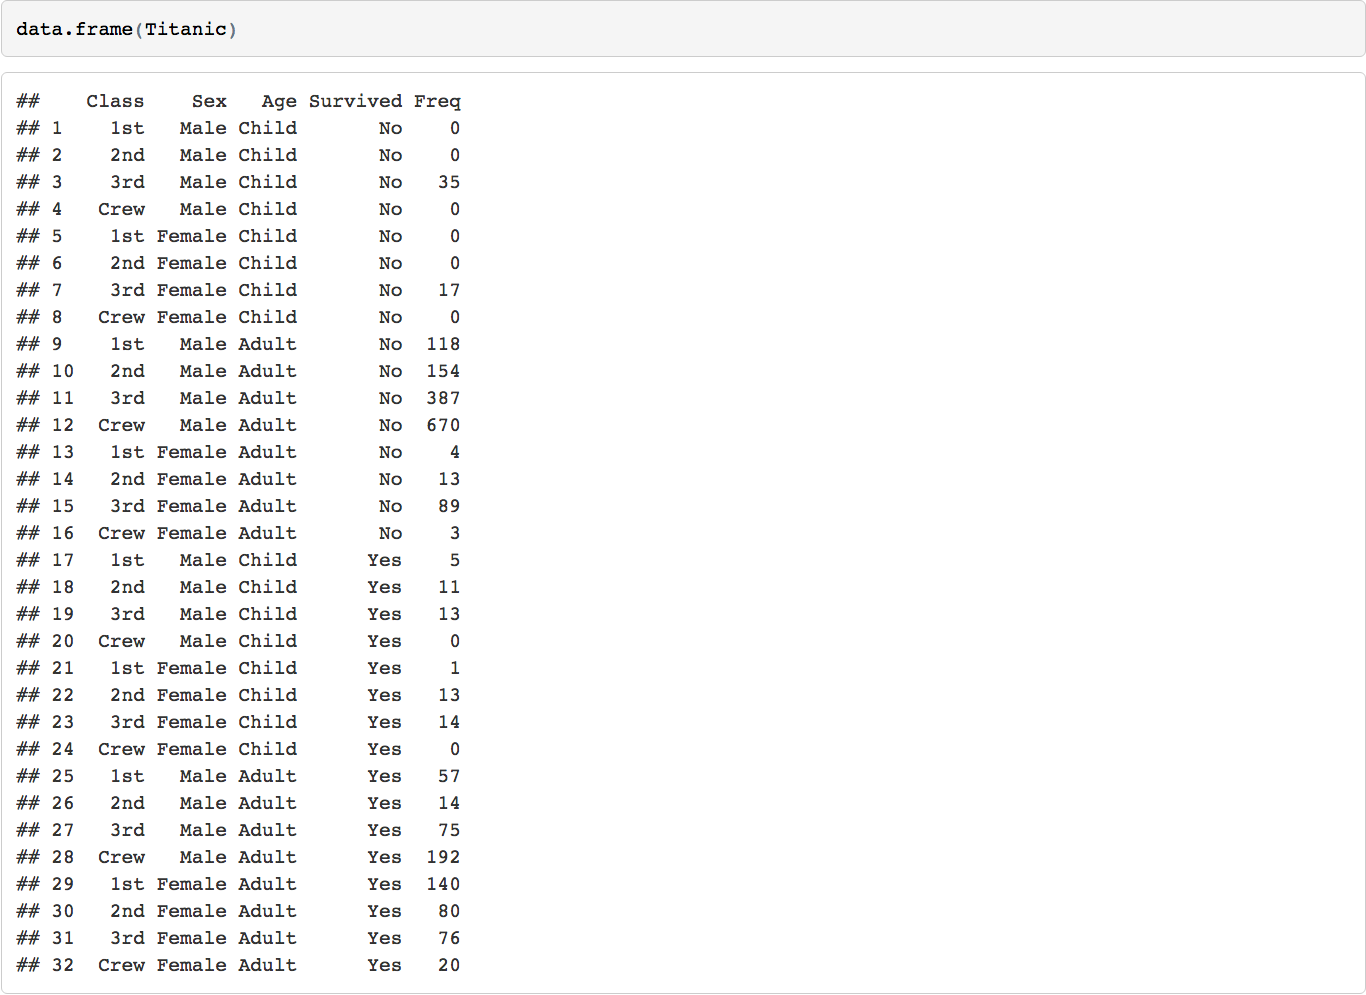
Let's start with a popular data.frame, the Titanic data
The structure of the data consists of 4 levels (Class, Sex, Age, Survived)
To slice the data we can set up a number of filters on it and slice it many to many outcomes. But this is iterative and can get cumbersome.
The d3 collapsible tree library can help create a simple picture of the structure. Below is a shiny app that displays the data structure and the reactive filters. The Table tab has in it the filtered datatable. Click on a node and see how the filters update and the reactive table. The filter rules are as follows:
- If a node is clicked then it is interpreted as being of interest and a logical expression is created to return it and its children.
- If specific siblings are clicked, and opened, then the non-clicked siblings are not returned.
You can also change the hierarchy order of the levels switching the order of the objects in the input box.
After getting the hang of how the tool works let's test it out on a real problem. For those of us who are familiar with MCMC simulators (such as BUGS, WinBUGS, JAGS and STAN) we know that simulation results, generated by these tools, can scale up in a hurry. For each simulation there are chains, burn ins, priors, posteriors etc. Comparing between different simulations is a task that becomes a labor intensive excercise. A great example of an online source for different model examples is the STAN github example repository. In it there are full examples coded with all the data files needed to run it locally on your own station, all you need to do is fork it and go at it.
We will focus on the book by Gelman and Hill Data Analysis Using Regression Analysis and Multilevel/Hierarchical Models which has a vast amount of ARM models coded in STAN and R.
A few things a new user, to the site, will ask themselves are
- How is it organized?
- What examples are in this book?
- How do I get to certain models across chapters?
- Do I need to fork the whole repo to run a few models instead of copy/paste?
For the first three questions there is a great Wiki section in the repository that you can click through but that gets confusing after 5 or 6 clicks (for me). How about if we leverage the information in all the readme files for each chapter and create a tree structure? We can change the hierarchy order as we want to answer our specific searches in real time and let the tree filter out the chosen examples for us. This can let us grow branches in different chapters by model type and combine simulations that fit our needs.
So we have a tool that can filter for us...ok...now what? We still need to run the code. Do we need to fork the whole repo to combine it to the tree? No!
As we all know, usually the code in your repo is built to be reproducible so you have in it the r files, data files (csv,xl,tab,sas, etc) and in our case the STAN files. What if you could just read the lines of code from the internet and set the working directory to the repository http path? This is what RunStanGit.r does. It downloads the lines of code, adds prefixes to the relevant read commands, comments out any plots and console print outs, and returns the output objects from the simulations. It is built to run nested calls that arise from source commands and fixes partial file paths to full url addresses. If the code is debugged in the repository, you can run script without cloning it.
We used this function to create the shiny app that holds no actual data in it but can simulate any example in the STAN ARM repository.
Once the user chooses the simulations they want to run from the tree, they press the simulate button. After all simulations are run, the outputs are placed in a list object to continue anaylsis. This can be through ShinyStan or any personal script you have written yourself.
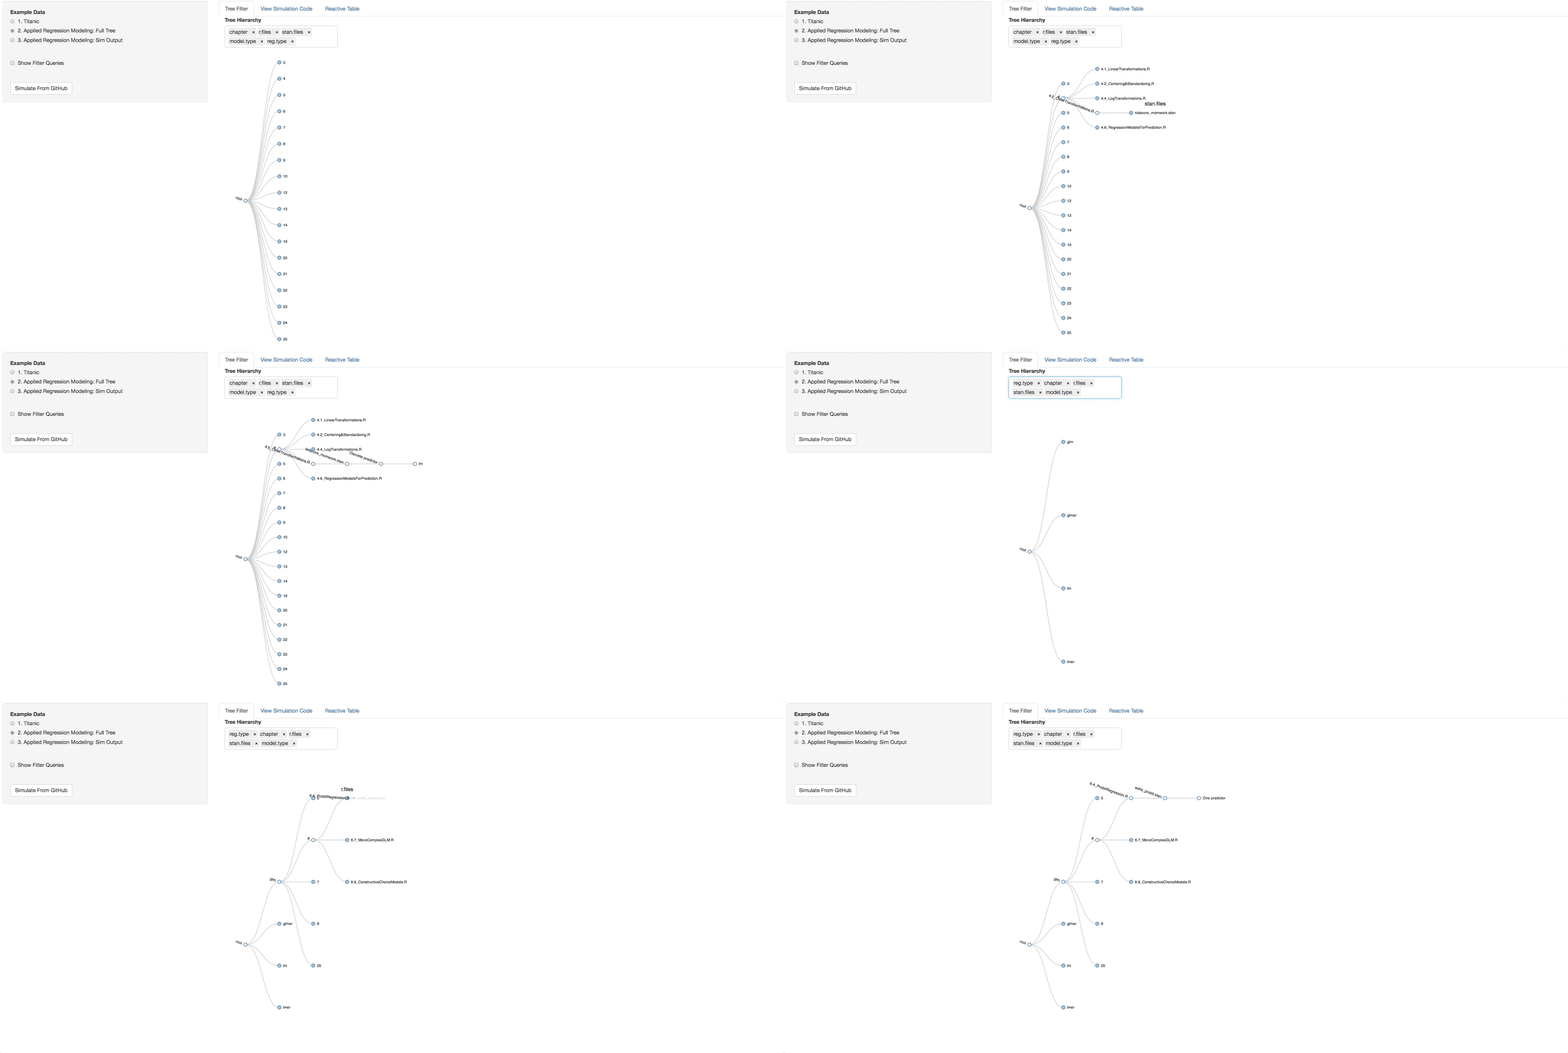
Now let's see the real example. The tree below is the visual representation of the whole ARM directory. A few things to try out to get the idea of how the book is layed out:
- Click on a chapter and see the types of models found in it
- Change the hierarchy around and get different perspectives of the book.
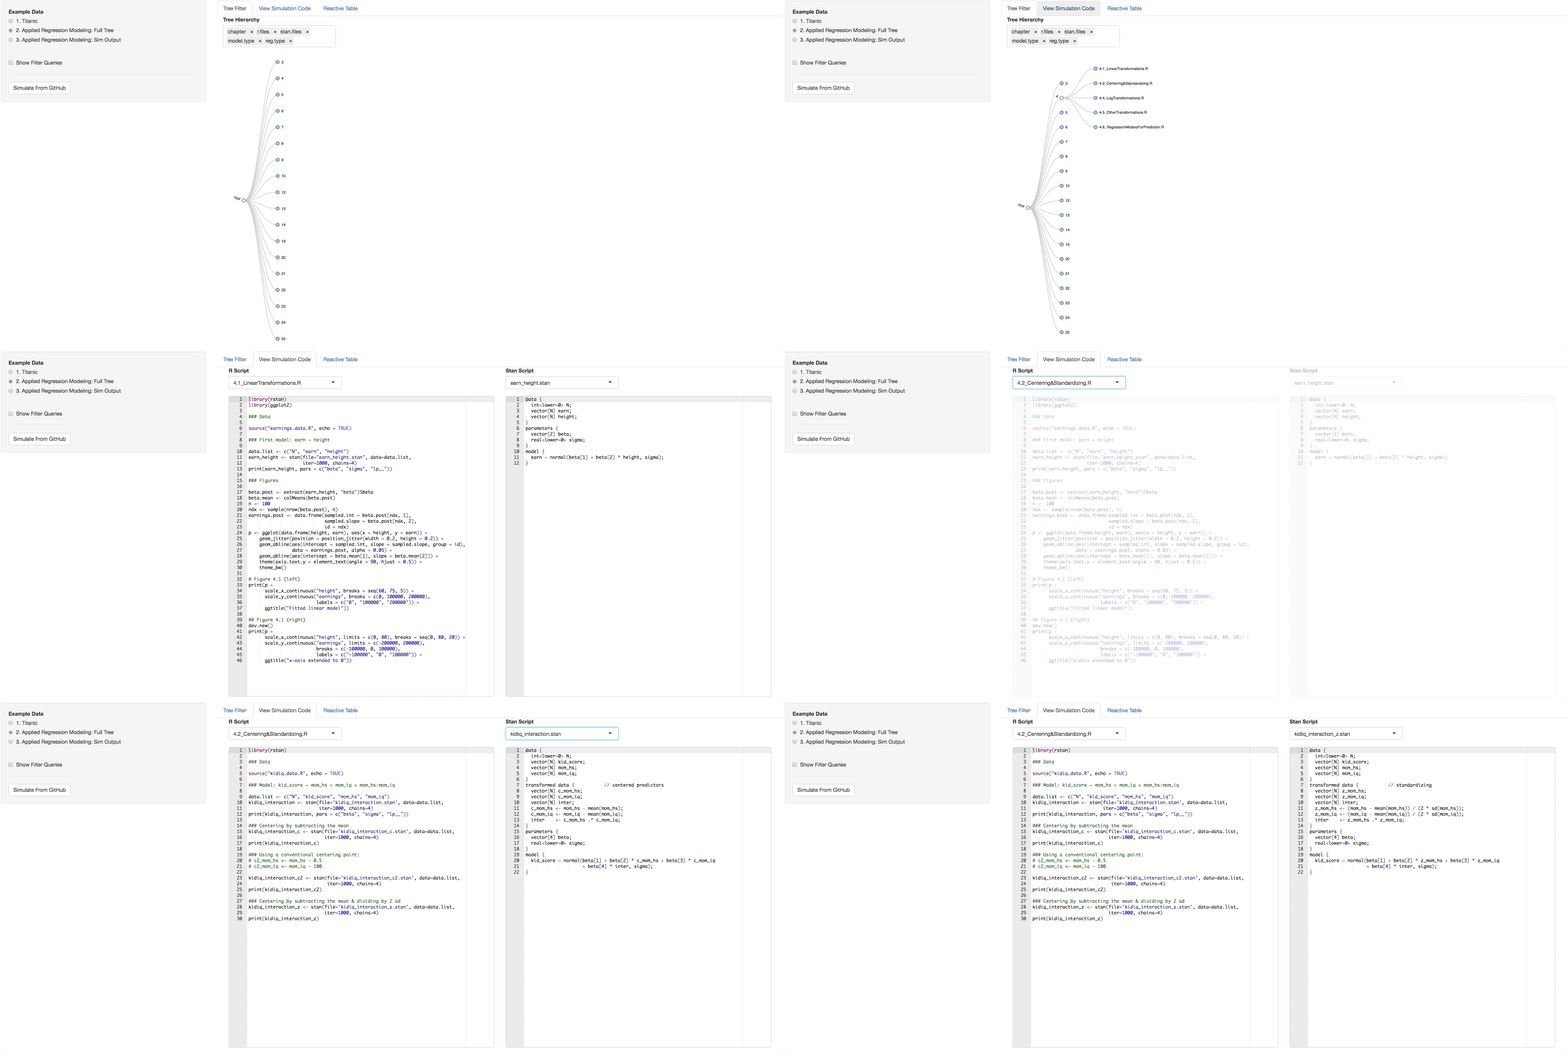
Let's say you clicked on chapter 4, now look in the additional Panel Tabs
- View Simulation Code tab: There you will see the code from github of the R files you selected and the STAN files that are found with in each R file. Click on the dropdown list above the consoles to navigate through them.
- Reactive Table tab: There you can see all the characterstics taken from the Readme files pertaining to the models you chose.
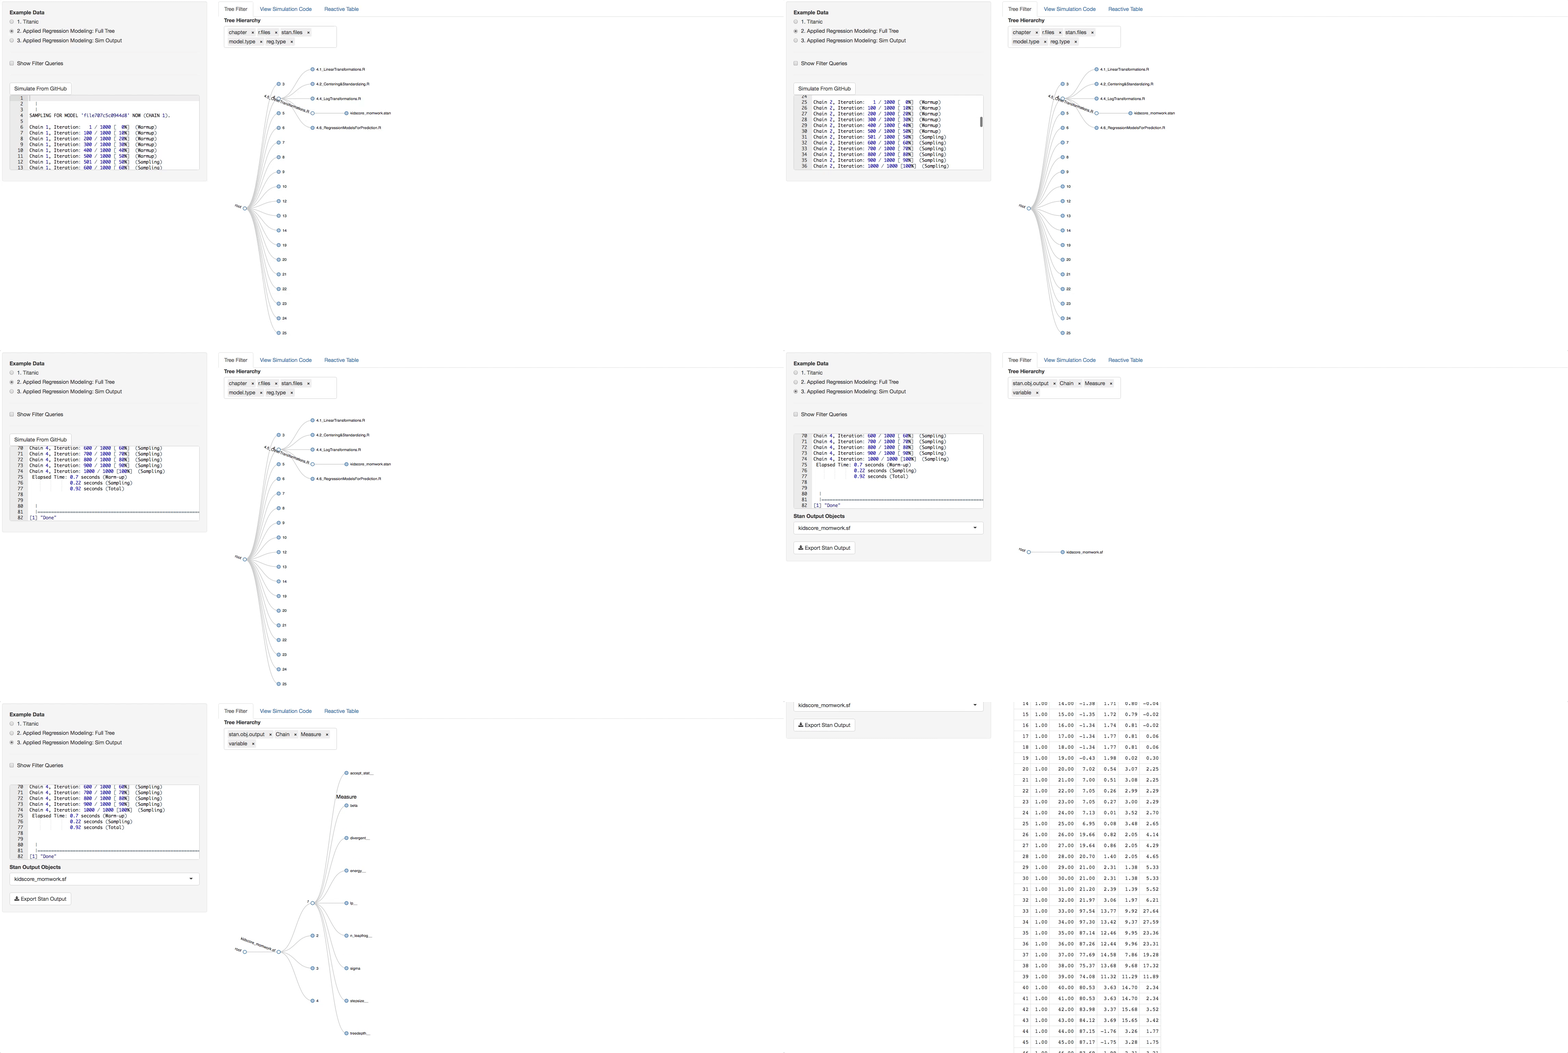
In the bottom radio button in the side panel you will see a static example of what a simulation output looks like. It has its own tree. Now you can pick what chains and variables you want, and see the output in the Reactive Table tab. You will be able to choose from a list of STAN output objects that will appear as a dropdown list in the side panel. The variables that you chose in the tree will appear in each table you select.
To try the remote call to github, go to the Tree Filter tab and filter to the branches and depth you want. Then just click on the button Simulate From Github. The output from the call replaces a default example that is loaded initially so you can go to the third radio button and see the output tree you generated.
Jonathan Sidi joined Metrum Researcg Group in 2016 after working for several years on problems in applied statistics, financial stress testing and economic forecasting in both industrial and academic settings.
To learn mode about additional open-source software packages developed by Metrum Research Group please visit the Metrum website


