Traffic Sign Recognition
Writeup
Build a Traffic Sign Recognition Project
The goals / steps of this project are the following:
- Load the data set (see below for links to the project data set)
- Explore, summarize and visualize the data set
- Design, train and test a model architecture
- Use the model to make predictions on new images
- Analyze the softmax probabilities of the new images
- Summarize the results with a written report
Writeup / README
Data Set Summary & Exploration
1. The basic summary of the data set
I used the pandas library to calculate summary statistics of the traffic signs data set:
- The size of training set is 34799
- The size of the validation set is 4410
- The size of test set is 12630
- The shape of a traffic sign image is (32, 32, 3)
- The number of unique classes/labels in the data set is 43
2. Distributions of the dataset
Here is an exploratory visualization of the data set. It is a bar chart showing how the data ...
Design and Test a Model Architecture
1. Data Preprocessing
There are 3 main steps for preprocces the data
- Convertin to grayscale image
- Normalizing the images
- Resize images to (32,32,1) [ only if data is not (32,32,1) ]
- Shuffle Data
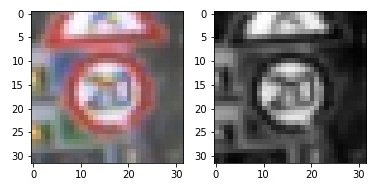
In real life the color can be important because of they have meaning for traffic signs. But here i don't see same sign with different color so, to make it simpler i converted the images to grayscale.
Here is an example of a traffic sign image before and after grayscaling.
Secon step is normalizing the data to the range (-1,1). The resulting dataset mean wasn't exactly zero, but it was reduced from around 82 to roughly -0.35.
2. Model Architecture -- Describe model architecture looks like including model type, layers, layer sizes, connectivity, etc.) Consider including a diagram and/or table describing the final model.
My final model consisted of the following layers:
| Layer | Description |
|---|---|
| Input | 32x32x1 Grayscale image |
| Convolution 5x5 | 1x1 stride - VALID - outputs 28x28x12 |
| RELU | |
| Max pooling | 2x2 stride, outputs 14x14x12 |
| Convolution 5x5 | 1x1 stride - VALID - outputs 10x10x25 |
| RELU | |
| Max pooling | 2x2 stride, outputs 5x5x25 |
| Flatten | input 5x5x25 - output 625 + Dropout |
| Fully connected | (625, 300) + Dropout |
| Fully connected | (300, 150) + Dropout |
| Fully connected | (150, 43) |
3. Train the model.
These are the training parameters:
- Learning_Rate = 0.001
- Epoch = 10
- Batch_size = 64
- mean = 0
- stddev = 0.1
Loss : softmax_cross_entropy
Optimizer : AdamOptimizer
4. Approach taken for finding a better solution.
My final model results were:
- Training set accuracy of ?
- Validation set accuracy of 0.99
- Test set accuracy of 0.94
I choosed the LeNet architecture. İt works very well on the digit recognation dataset. Our data kind of similar with the digits for examples speed limit signs. But the initial model was not enough good to get a acceptable result from test set. The model was overfit with the training data when i test with other dataset model was not able to predict correctly. To get better accuracy on test set and prevent from overfitting i added 1 more full connected layer and 3 dropout after flatten and first 2 full connected layer. Also i increase the filter size. These are the some of techniques for prevent overfitting that's why i decided to do these. After these changes, the model having nice result from validation and test dataset.
Simply:
- Add fully-connected layer
- Add dropout
- İncrease filter size
Test a Model on New Images
1. Choose five German traffic signs found on the web and provide them in the report. For each image, discuss what quality or qualities might be difficult to classify.
Here are five German traffic signs that I found on the web:
These images are very similiar with the train data. Only "Speed Limit 70" is different from training set because it is not a real photo. Also some of the images are a little bit dark.
2. Model's predictions on these new traffic signs
Here are the results of the prediction:
| Image | Prediction |
|---|---|
| Vehicles over 3.5 metric tons prohibited | Vehicles over 3.5 metric tons prohibited |
| Speed limit (70km/h) | Speed limit (70km/h) |
| Speed limit (20km/h) | Speed limit (20km/h) |
| Turn right ahead | Turn right ahead |
| Right-of-way at the next intersection | Right-of-way at the next intersection |
| Keep right | Keep right |
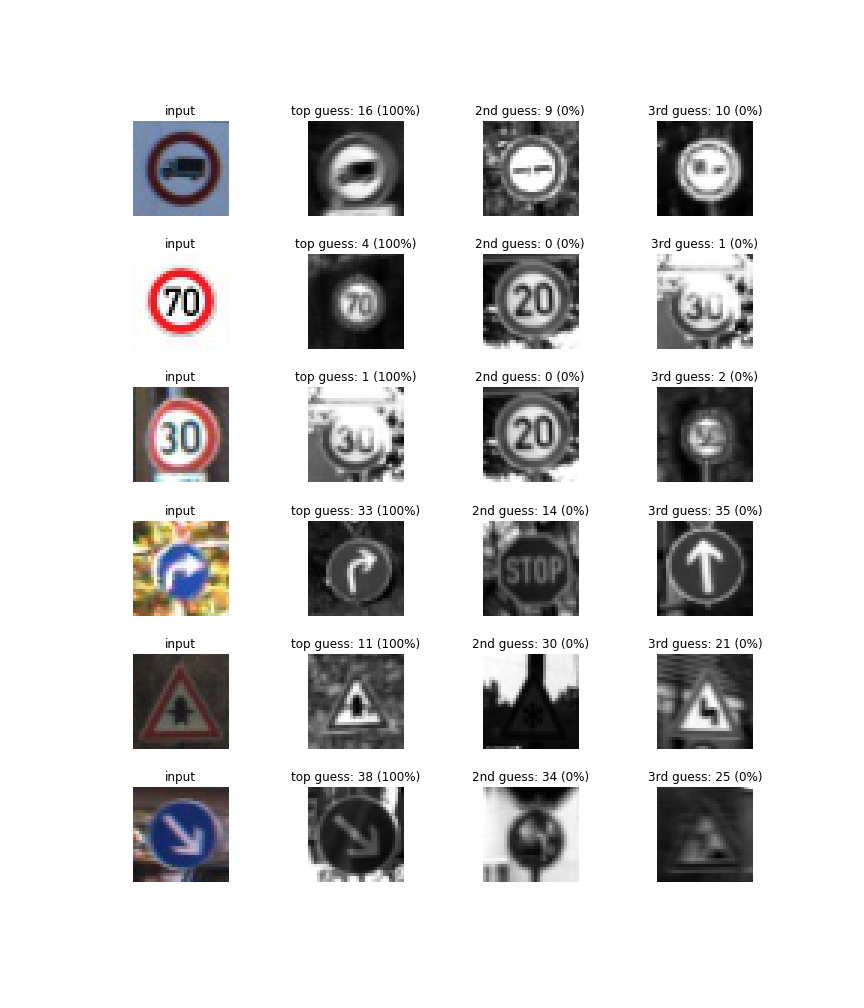
The model was able to correctly guess 6 of the 6 traffic signs, which gives an accuracy of 100%.
3. Softmax probabilities
The code for making predictions on my final model is located in the 20th cell of the Ipython notebook.
Simply, the model complately sure about these 6 images probabibility and can predict almost %100 accuracy. Reaching such a high result could be a sign of overfitting.
Example result for " Keep right " traffic sing.
| Probability | Prediction |
|---|---|
| .99 | Keep right |
| .0 | U-turn |
| .0 | Yield |
| .0 | Bumpy Road |
| .0 | Slippery Road |


