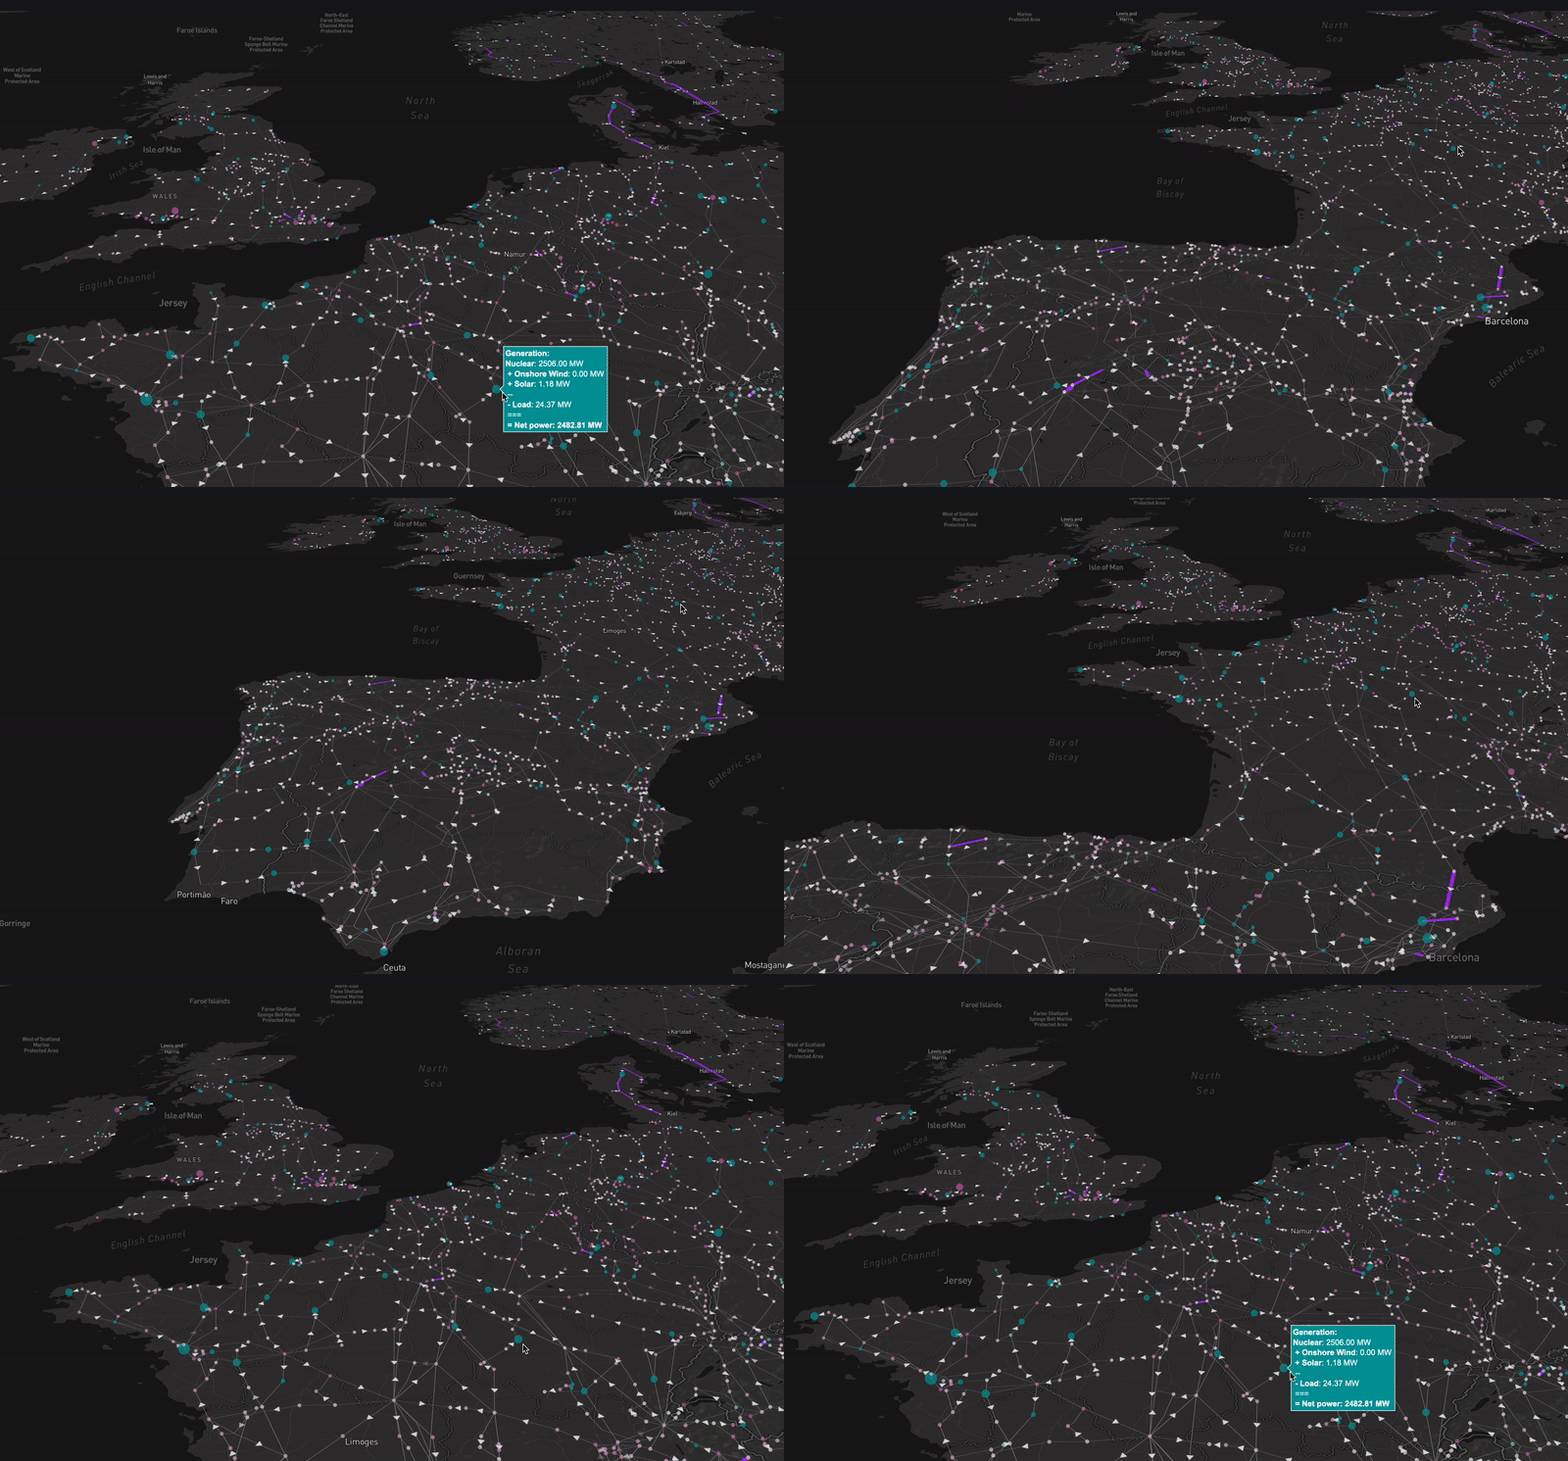
A simple Plotly/Dash web app for visualising power flow optimisation
solutions from pypsa-eur.
The web app is deployed here, along with an explanation of the main features.
The pypsa-eur configuration used for the network plotted here can be
found in my fork of the pypsa-eur repo:
zoltanmaric/pypsa-eur
Installing the dependencies requires Conda, but I recommend installing
Mamba
(a fully compatible, but better implementation of Conda).
After having installed mamba, just create and activate the Conda
environment by running
conda env create -f environment.yml
conda activate coppersushi
Then you can start the server by running
python app.pyOnce the server starts, the web app will be available at http://localhost:8050
After creating the Heroku app, run the following to deploy it:
heroku container:push web
heroku container:release web
(based on https://github.com/heroku-examples/python-miniconda)
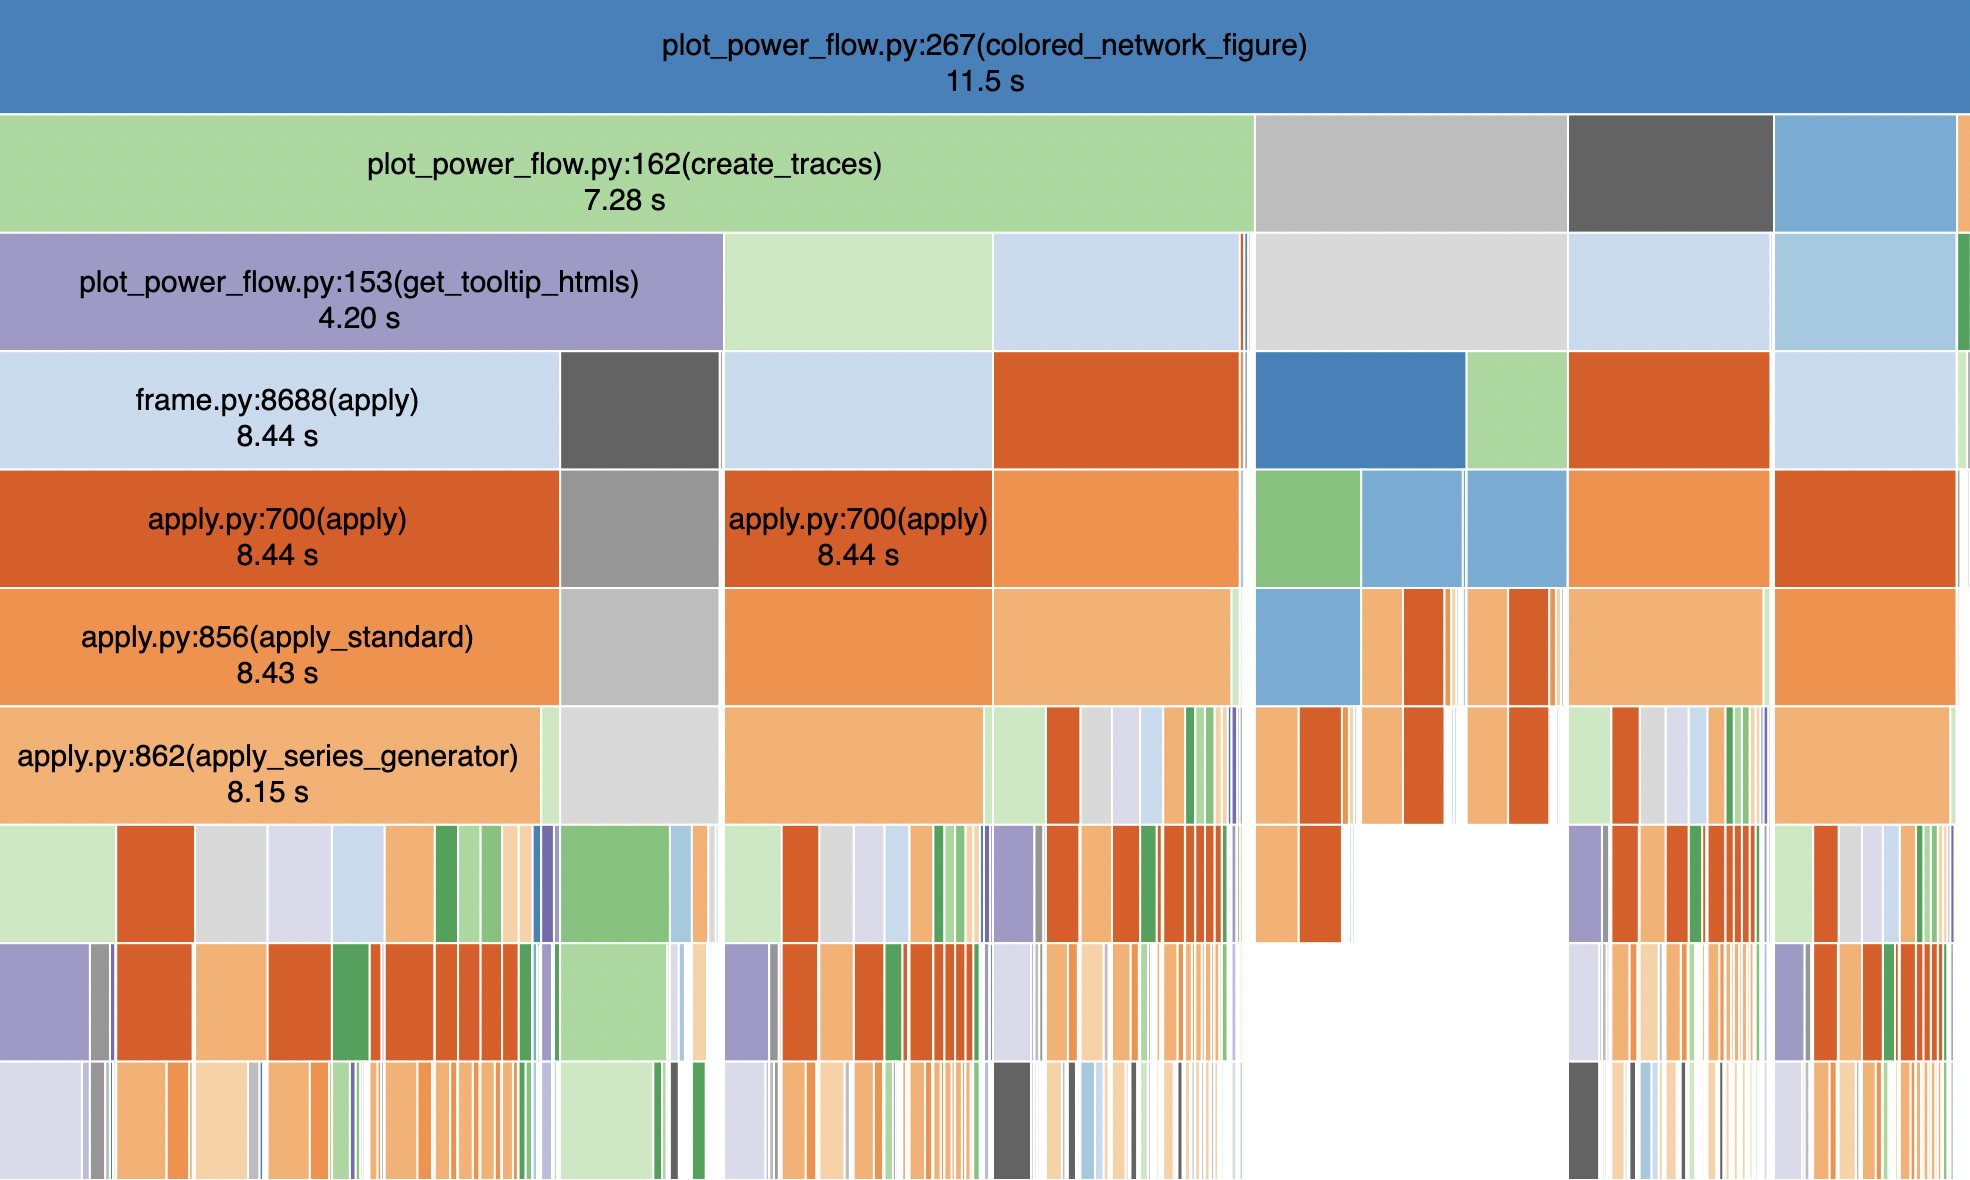
Run the following to show a snakeviz chart
of function call durations in your browser.
PYTHONPATH=. python profiling/profiling.py
snakeviz profiling/plot.prof
