Run the file giss.R in R to generate the visual below. The code is 29 lines long and pulls the source data directly from the NASA GISSTEMP homepage.
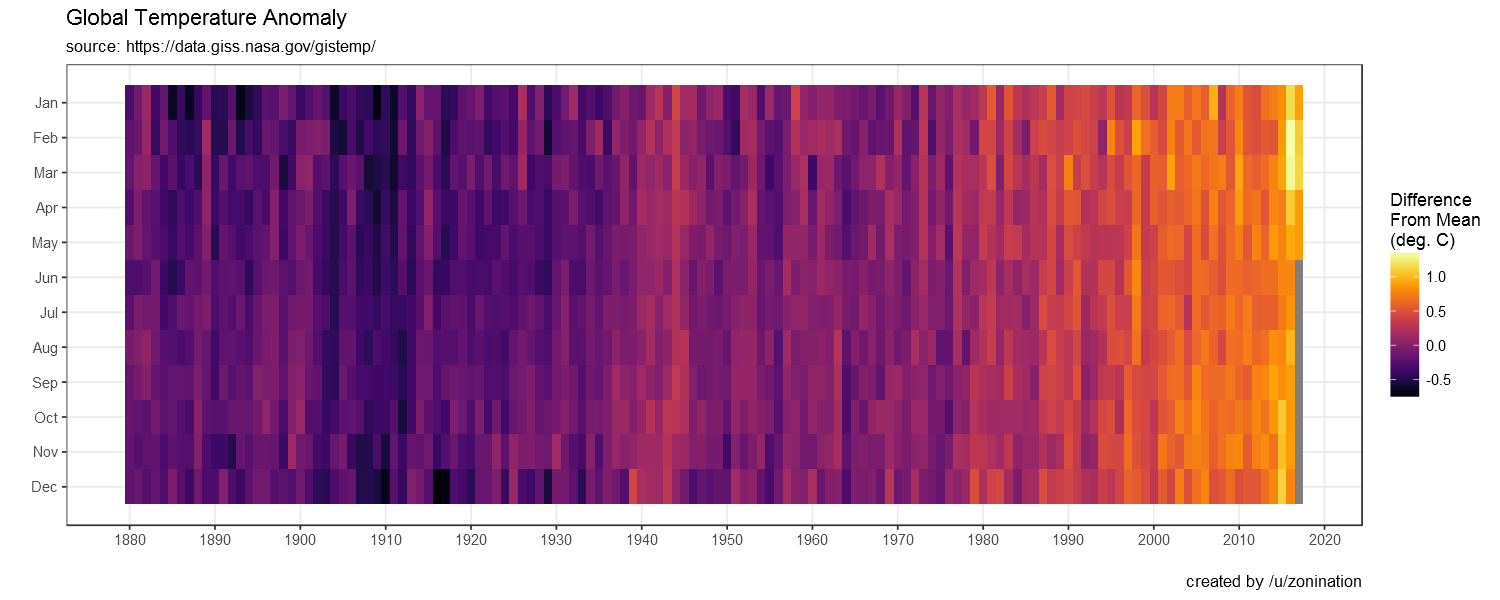
Source: https://data.giss.nasa.gov/gistemp/
The R code is designed to pull the source directly from the webpage. Post an issue if this changes.