prom2click
Prom2click is a Prometheus remote storage adapter for Clickhouse. This project is in the early stages, beta testers are welcome :). Consider it experimental - that said it is quite promising as a scalable and highly available remote storage for Prometheus.
It's functional and writing metrics into Clickhouse in configurable batch sizes. Note that (currently) it is cpu hungry so you'll need a decent number of cores to sustain higher ingestion rates (eg. > hundreds of thousands/second). Also, it is missing some bits like doco, proper logging, tests and database error handling.
If you've not heard of Clickhouse before it's a column oriented data store designed for real time analytic workloads on massive data sets (100's of tb+). It also happens to be pretty well suited for storing/retreiving time series data as it supports compression and has a Graphite type rollup on arbitrary tables/columns.
./bin/prom2click --help
Usage of ./bin/prom2click:
  -ch.batch int
        Clickhouse write batch size (n metrics). (default 8192)
  -ch.buffer int
        Maximum internal channel buffer size (n requests). (default 8192)
  -ch.db string
        The clickhouse database to write to. (default "metrics")
  -ch.dsn string
        The clickhouse server DSN to write to eg.tcp://host1:9000?username=user&password=qwerty&database=clicks&read_timeout=10&write_timeout=20&alt_hosts=host2:9000,host3:9000(see https://github.com/kshvakov/clickhouse). (default "tcp://127.0.0.1:9000?username=&password=&database=metrics&read_timeout=10&write_timeout=10&alt_hosts=")
  -ch.maxsamples int
        Maximum number of samples to return to Prometheus for a remote read request - the minimum accepted value is 50. Note: if you set this too low there can be issues displaying graphs in grafana. Increasing this will cause query times and memory utilization to grow. You'll probably need to experiment with this. (default 8192)
  -ch.minperiod int
        The minimum time range for Clickhouse time aggregation in seconds. (default 10)
  -ch.quantile float
        Quantile/Percentile for time series aggregation when the number of points exceeds ch.maxsamples. (default 0.75)
  -ch.table string
        The clickhouse table to write to. (default "samples")
  -log.format value
        Set the log target and format. Example: "logger:syslog?appname=bob&local=7" or "logger:stdout?json=true" (default "logger:stderr")
  -log.level value
        Only log messages with the given severity or above. Valid levels: [debug, info, warn, error, fatal]
  -version
        Version
  -web.address string
        Address to listen on for web endpoints. (default ":9201")
  -web.metrics string
        Address to listen on for metric requests. (default "/metrics")
  -web.timeout duration
        The timeout to use for HTTP requests and server shutdown. Defaults to 30s. (default 30s)
  -web.write string
        Address to listen on for remote write requests. (default "/write")
Getting started
-
-
If you run ubuntu they have debs, otherwise.. well.. containers? (I'm running it in lxc with net=none on some Redhat based systems)
-
Configure Clickhouse graphite rollup settings in config.xml (bottom lines in config.xml)
-
Goto Tabix for a quick and easy Clickhouse UI
-
Create clickhouse schema
CREATE DATABASE IF NOT EXISTS metrics;
CREATE TABLE IF NOT EXISTS metrics.samples
    (
          date Date DEFAULT toDate(0),
          name String,
          tags Array(String),
          val Float64,
          ts DateTime,
          updated DateTime DEFAULT now()
    )
    ENGINE = GraphiteMergeTree(
          date, (name, tags, ts), 8192, 'graphite_rollup'
    );
-
For a more resiliant setup you could setup shards, replicas and a distributed table
- setup a Zookeeper cluster (or zetcd)
- eg. for each clickhouse shard run two+ clickhouse servers and setup a ReplicatedGraphiteMergeTree on each with the same zk path and uniq replicas (eg. replace {replica} with the servers fqdn)
- next create a distributed table that looks at the ReplicatedGraphiteMergeTrees
- either define the {shard} and {replica} macros in your clickhouse server config or replace accordingly when you run the queries on each host
- see: Distributed and Replicated
     CREATE DATABASE IF NOT EXISTS metrics;
     CREATE TABLE IF NOT EXISTS metrics.samples
     (
           date Date DEFAULT toDate(0),
           name String,
           tags Array(String),
           val Float64,
           ts DateTime,
           updated DateTime DEFAULT now()
     )
     ENGINE = ReplicatedGraphiteMergeTree(
           '/clickhouse/tables/{shard}/metrics.samples',
           '{replica}', date, (name, tags, ts), 8192, 'graphite_rollup'
     );

     CREATE TABLE IF NOT EXISTS metrics.dist
     (
           date Date DEFAULT toDate(0),
           name String,
           tags Array(String),
           val Float64,
           ts DateTime,
           updated DateTime DEFAULT now()
     ) ENGINE = Distributed(metrics, metrics, samples, sipHash64(name));
-
-
Install/Configure Grafana
-
(optional) Install the Clickhouse Grafana Datasource Plugin
sudo grafana-cli plugins install vertamedia-clickhouse-datasource -
Install Prometheus and configure a remote read and write url
# Remote write configuration (for Graphite, OpenTSDB, InfluxDB or Clickhouse).
remote_write:
    - url: "http://localhost:9201/write"
remote_read:
    - url: "http://localhost:9201/read"
-
Build prom2click and run it
- Install go and glide
$ make get-deps
$ make build
$ ./bin/prom2click
-
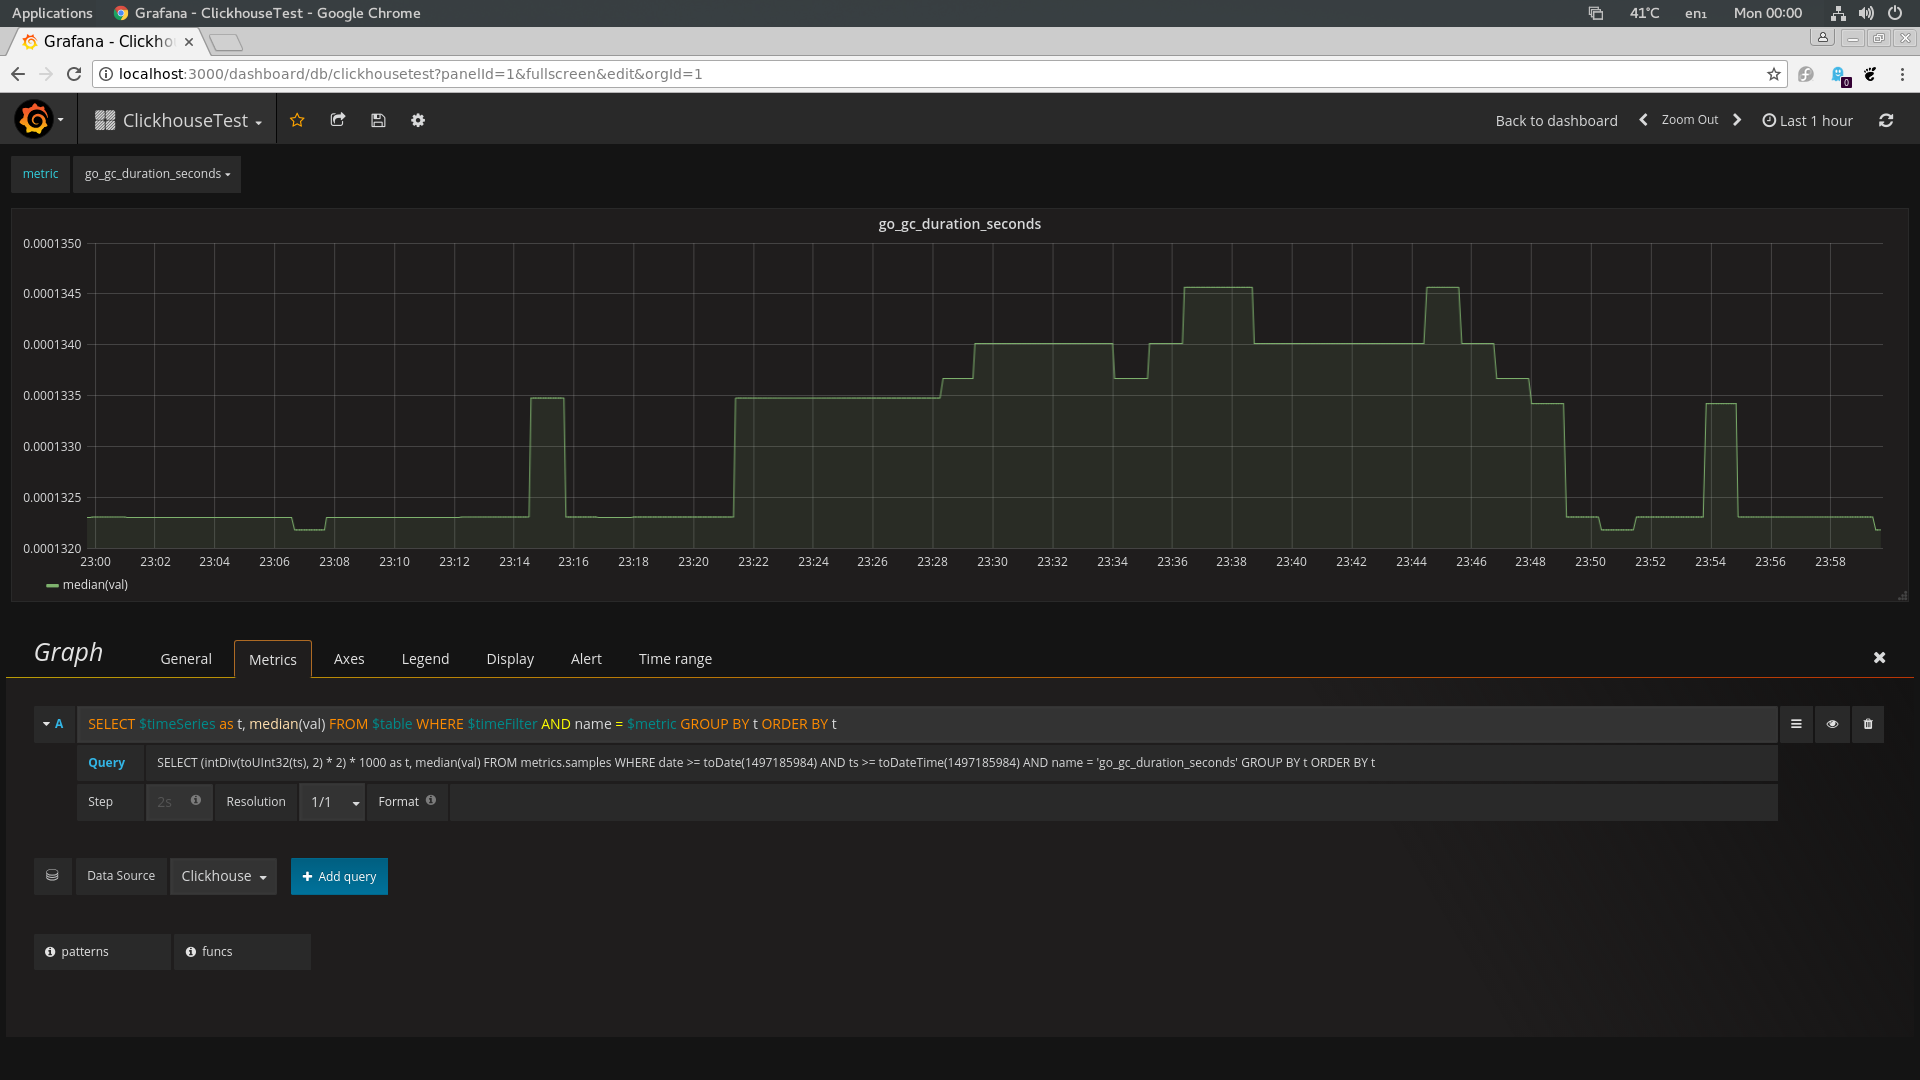
Create a dashboard
- This example was created with the Clickhouse datasource - you'll likely want to use the Prometheus data source though
- Example template query
SELECT DISTINCT(name) FROM metrics.samples
- Example query
SELECT $timeSeries as t, median(val) FROM $table WHERE $timeFilter
    AND name = $metric GROUP BY t ORDER BY t
- Basic graph
Testing
make test
..there are no tests (yet)..
Misc Notes / Todo
- add missing metrics (eg. read query metrics, nrows, failures, latency etc)
- add a clickhouse metric exporter
- possibly create a ticker to flush enqueued metrics at a constant rate
- add logging support, remove prints
- try the in-memory Buffer table engine to buffer writes
- add proper db error handling
- add tests
