Presentation can be found on this link.
We are all interested in weather data, but more specifically interested in the tornado events that occur both locally and nationally. Our project is to look at the geographic distribution of tornado events in the United States, with focus on the various “measurements of impact”, from the loss of life to the financial ramifications, and explore how the geographic distribution and measurements of impact for Indiana measure up against the national results.
This was a team project and I authored the notebook Tornado Impact - Data Exploration and Cleanup.ipynb. In the notebook Tornado Impact - Data Analysis.ipynb I wrote all first chapters before "EF and F Scale Analysis".
In this research we are using publicly available NCEI Storm Events Database. It contains various types of storms from January 1950 to December 2019, entered by NOAA's National Weather Service (NWS). Data are available in comma-separated value (CSV) files, three files per year: "details", "locations" and "fatalities".
In our research we will be using only "details" files from 1996 to 2019.
We kept only data for tornado events and reduced the number of features from 51 to 11. The cleanup process is described in detail in the notebook Tornado Impact - Data Exploration and Cleanup.ipynb. The output file was save in the csv format: Outputs/Tornado_heatmap_cities.csv.
This phase is described in the notebook Tornado Impact - Data Analysis.ipynb.
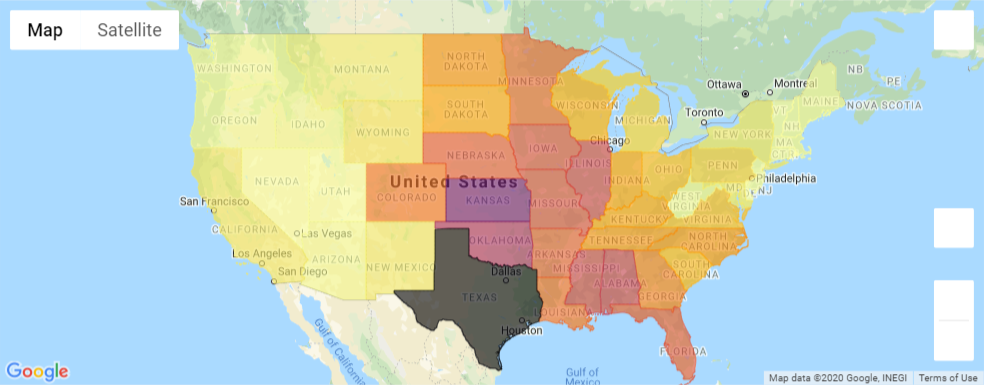
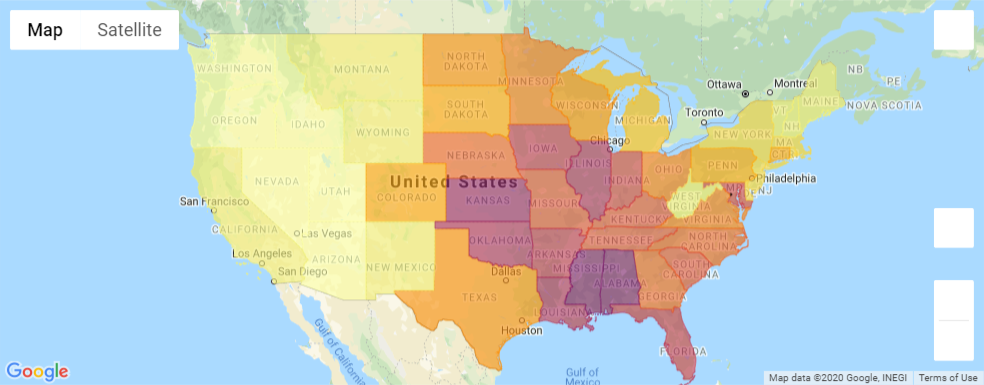
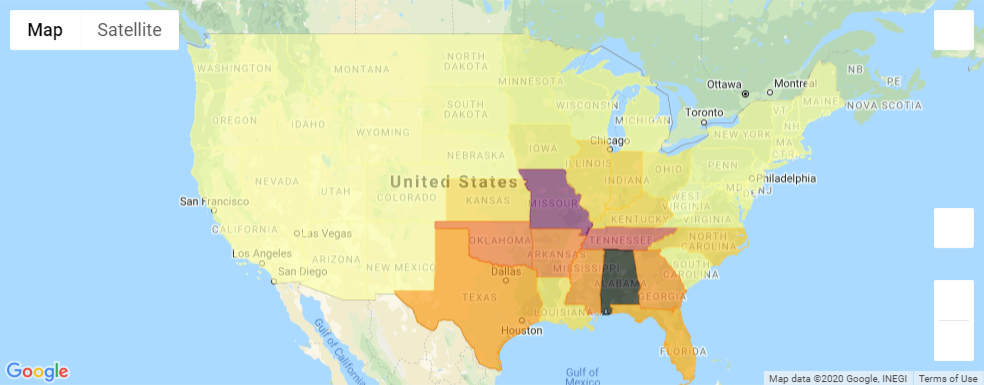
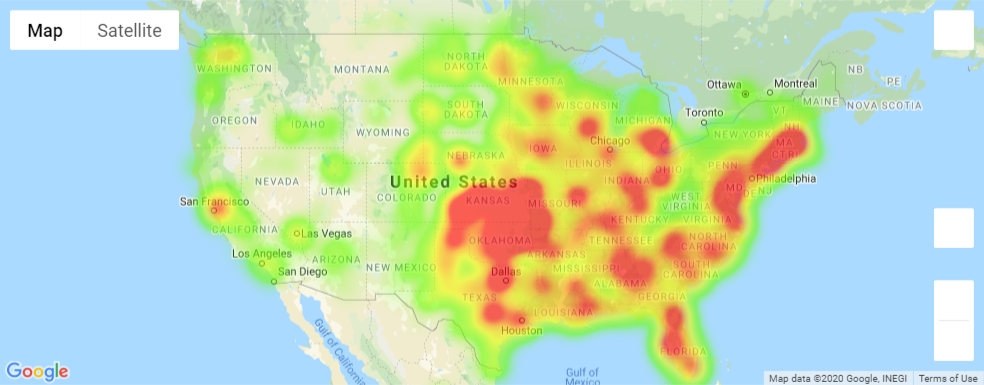
To see the maps in the notebook you will need to rerun the notebook, so I will display all maps in this README.
-
Python
-
Pandas
-
Matplotlib
-
Jupyter Notebook
-
Choropleth maps with GeoJSON
-
numpy
-
gmaps
-
citipy
-
cpi
As we mentioned earlier, we are using only "details" files from 1996 to 2019 from NCEI Storm Events Database.
The file Storm-Data-Export-Format.pdf contains detailed information about all feature in these files.
Due to size limits, 24 input files are zipped to 5 files.
- Outputs/Tornadoheatmapcities.csv - an output from the cleanup stage and an input to data analysis
-
Number of records: 33,006
-
Columns:
- EVENT_ID
- STATE
- YEAR
- MONTH_NAME
- BEGIN_DATE_TIME
- TOR_F_SCALE
- BEGIN_LAT
- BEGIN_LON
- INJURIES
- DEATHS
- DAMAGE
- Damir Zunic (zunicd@yahoo.com):
- notebook Tornado Impact - Data Exploration and Cleanup.ipynb
- notebook Tornado Impact - Data Analysis.ipynb:
- Introduction
- Choropleth maps with GeoJSON
- Additional insights from Tornado Data
- Andrea Johnson (asjohnson099@gmail.com):
- notebook Tornado Impact - Data Analysis.ipynb:
- Damage Stats and FEMA Data
- notebook Tornado Impact - Data Analysis.ipynb:
- Lindsey Downs (ldowns@butler.edu):
- notebook Tornado Impact - Data Analysis.ipynb:
- EF and F Scale Analysis
- notebook Tornado Impact - Data Analysis.ipynb:
