Metric collection and Dashboards for Apache Cassandra (2.2, 3.0, 3.11, 4.0) clusters.
Metric Collector for Apache Cassandra (MCAC) aggregates OS and C* metrics along with diagnostic events to facilitate problem resolution and remediation. It supports existing Apache Cassandra clusters and is a self contained drop in agent.
-
Built on collectd, a popular, well-supported, open source metric collection agent. With over 90 plugins, you can tailor the solution to collect metrics most important to you and ship them to wherever you need.
-
Easily added to Cassandra nodes as a java agent, Apache Cassandra sends metrics and other structured events to collectd over a local unix socket.
-
Fast and efficient. It can track over 100k unique metric series per node (i.e. hundreds of tables).
-
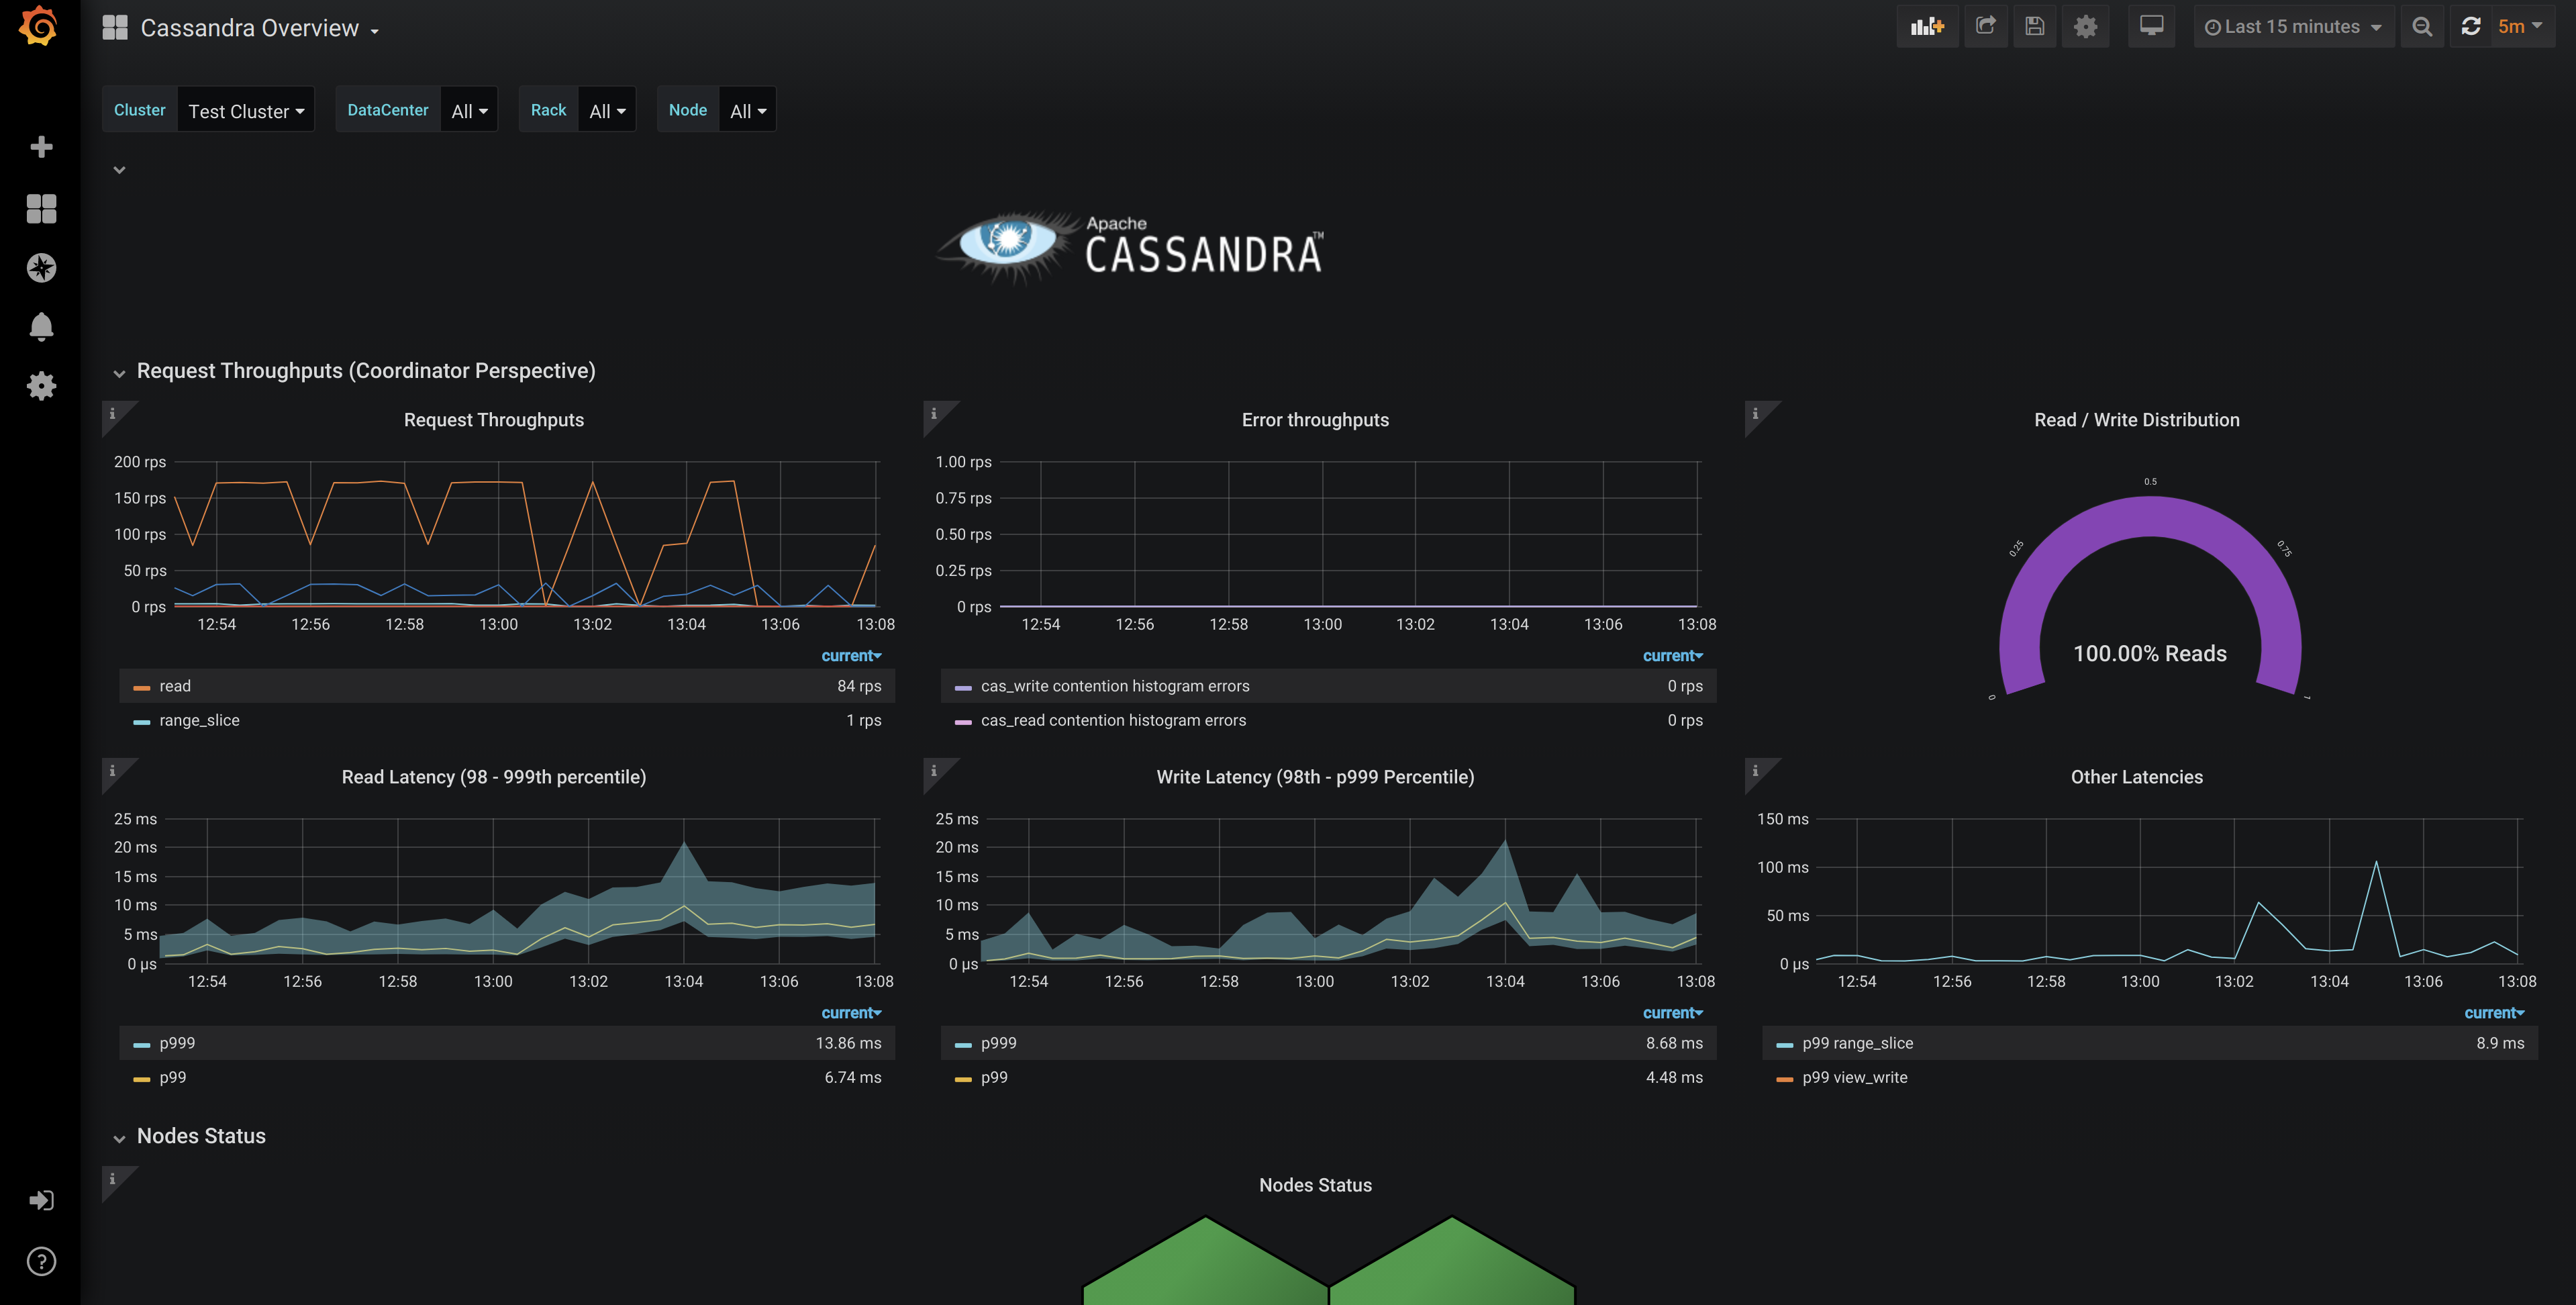
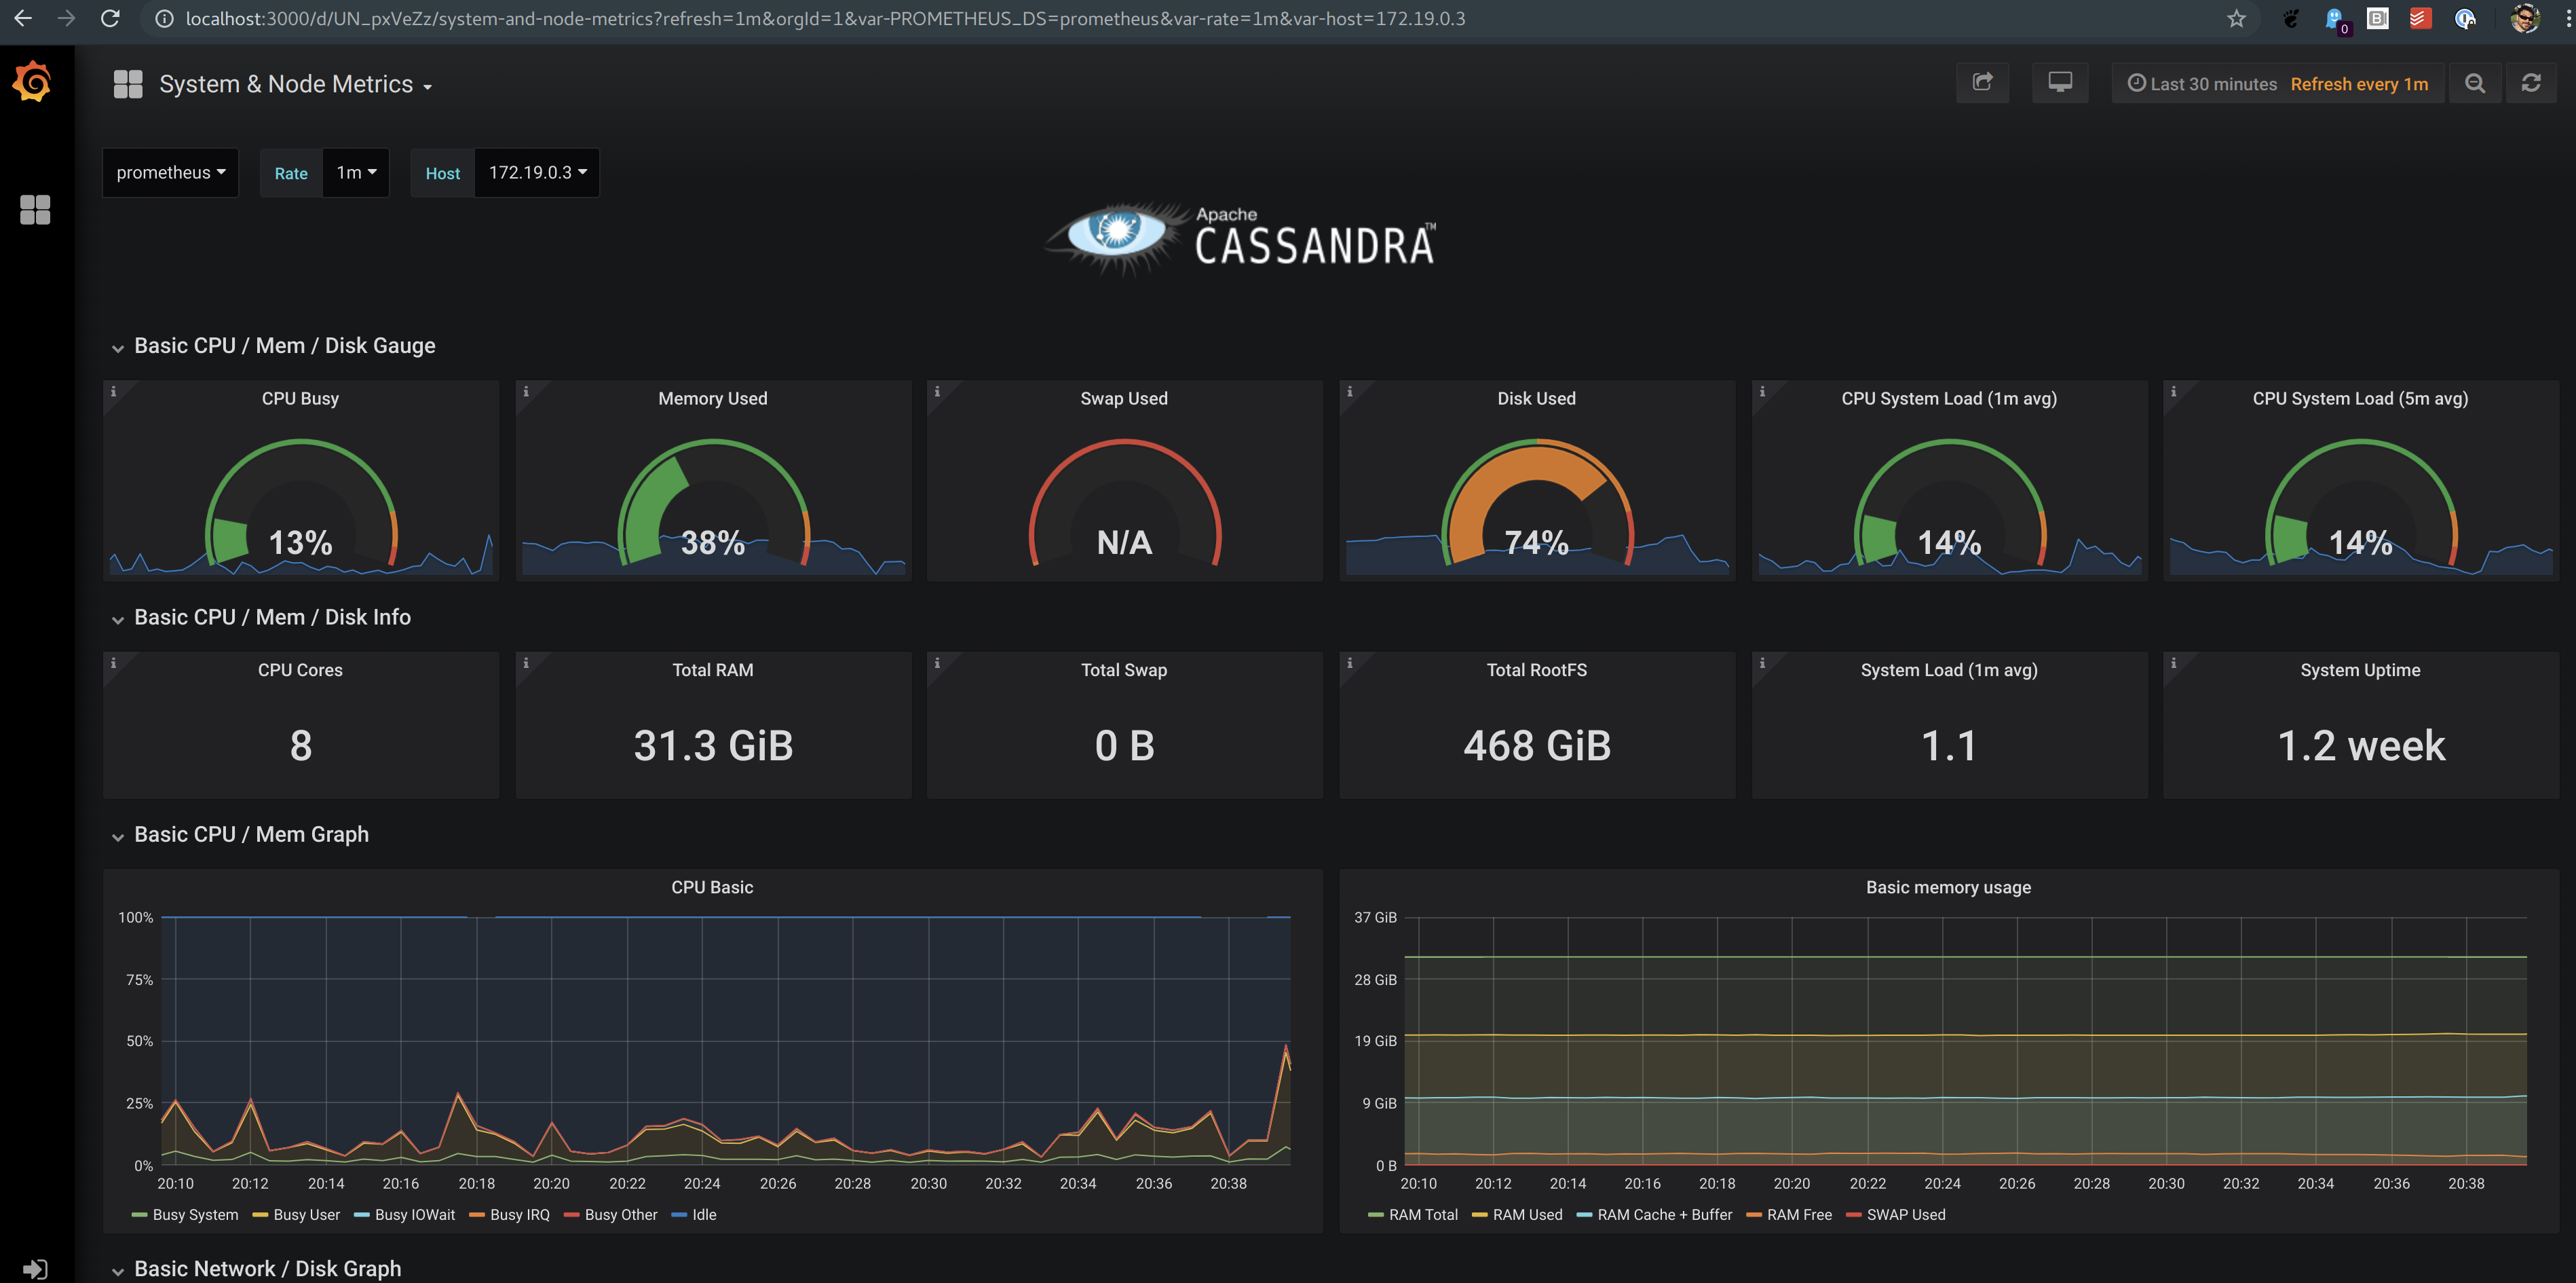
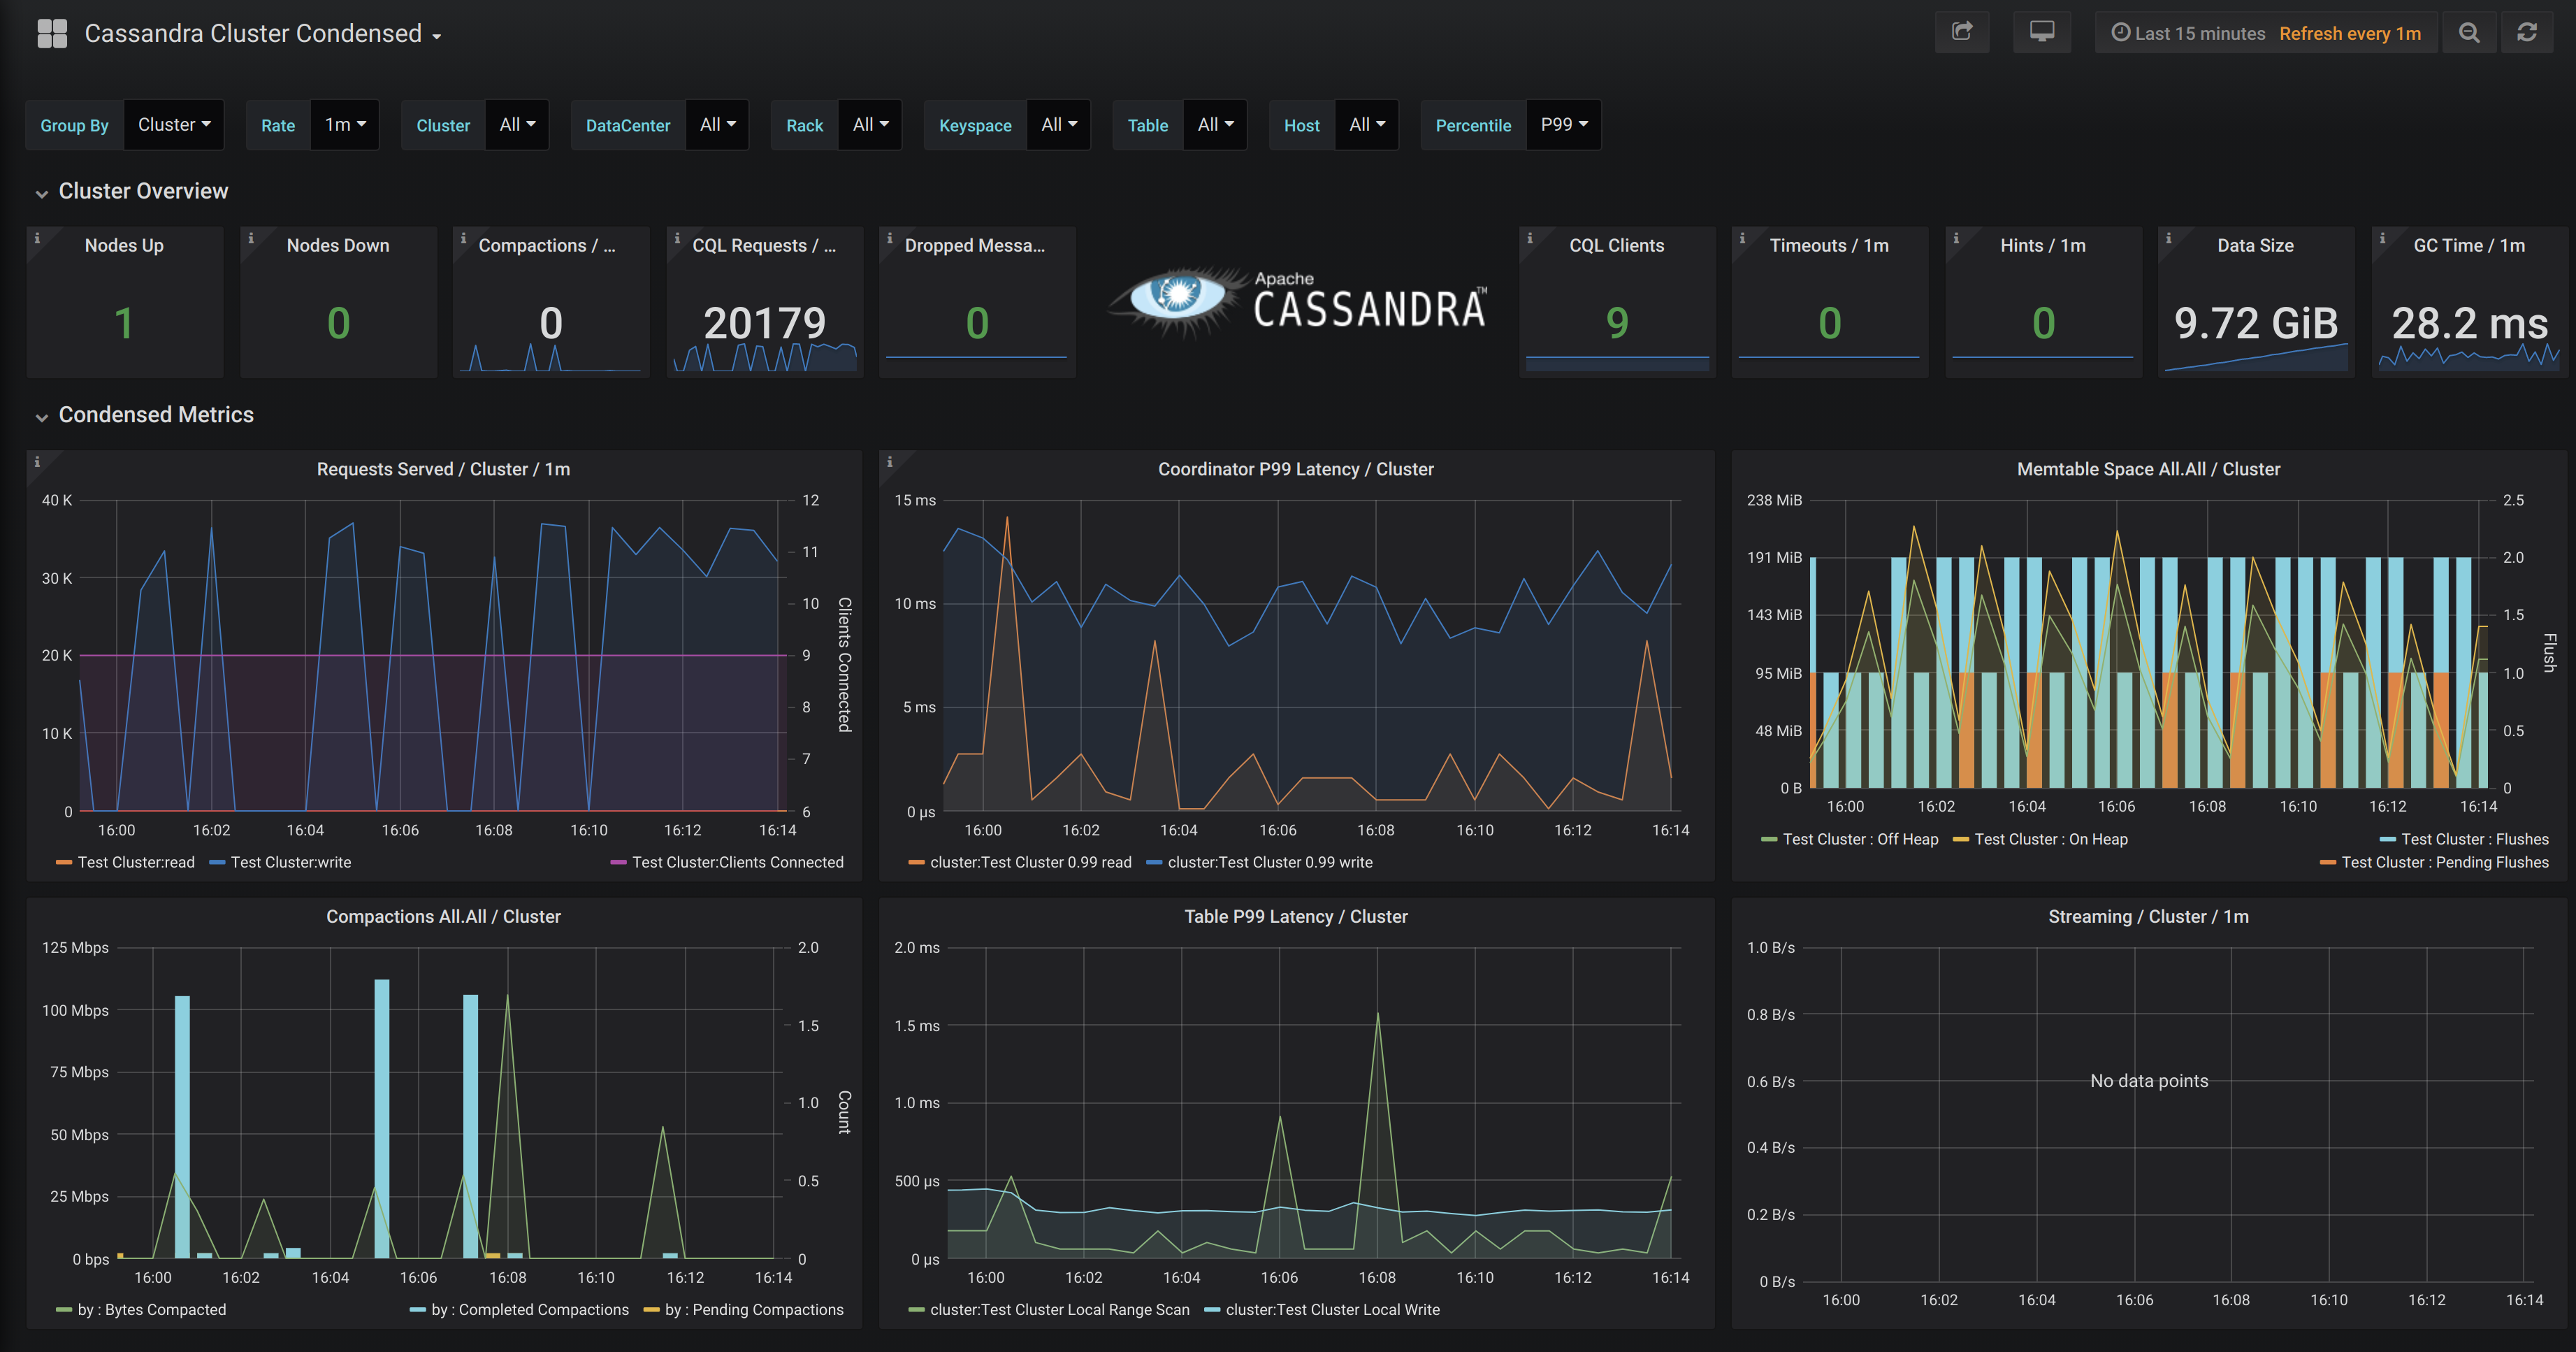
Comes with extensive dashboards out of the box, built on prometheus and grafana.
The Cassandra dashboards let you aggregate latency accurately across all nodes, dc or rack, down to an individual table.
- Little/No performance impact to C*
- Simple to install and self managed
- Collect all OS and C* metrics by default
- Keep historical metrics on node for analysis
- Provide useful integration with prometheus and grafana
docker-compose up is all you need from the dashboards/demo directory to get a cluster with a light
workload and dashboards connected to kick the tires.
- Download the latest release of the agent onto your Cassandra nodes.
The archive is self contained so no need do anything other than
tar -zxf latest.tar.gzinto any location you prefer like/usr/localor/opt.
NOTE: For Cassandra 4.1.x and newer, you will need to use the release bundle with -4.1-beta1 appended.
For Cassandra 4.0.x and lower, you will need to use the release bundle without the extra prefix.
See below for more.
-
Add the following line into the
cassandra-env.shfile:MCAC_ROOT=/path/to/directory JVM_OPTS="$JVM_OPTS -javaagent:${MCAC_ROOT}/lib/datastax-mcac-agent.jar" -
Bounce the node.
On restart you should see 'Starting DataStax Metric Collector for Apache Cassandra' in the Cassandra system.log
and the prometheus exporter will be available on port 9103
The config/metric-collector.yaml file requires no changes by default but please read and add any customizations like filtering of metrics you don't need.
The config/collectd.conf.tmpl file can also be edited to change default collectd plugins enabled. But it's recommended you use the include path pattern to configure extra plugins.
-
Download the latest release of the dashboards and unzip.
-
Install Docker compose
-
Add the list of C* nodes with running agents to tg_mcac.json
-
docker-compose upwill start everything and begin collection of metrics -
The Grafana web ui runs on port
3000and the prometheus web ui runs on port9090
If you have an existing prometheus setup you will need the dashboards and relabel config from the included prometheus.yaml file.
The supported versions of Apache Cassandra: 2.2+ (2.2.X, 3.0.X, 3.11.X, 4.0, 4.1)
NOTE: There is a different install bundle for the agent for Cassandra 4.1 and newer.
For Cassandra 4.0.x and older, use the bundles without the -4.1-beta1 suffix.
For Cassandra 4.1.x and newer, use the bundles with the -4.1-beta1 suffix.
The Dashboard bundles can be used with any version of Cassandra.
Check out the dashboards/k8s-build directory for a guide on using this project along with Kubernetes.
-
Where is the list of all Cassandra metrics?
The full list is located on Apache Cassandra docs site. The names are automatically changed from CamelCase to snake_case.
In the case of prometheus the metrics are further renamed based on relabel config which live in the prometheus.yaml file.
-
How can I filter out metrics I don't care about?
Please read the metric-collector.yaml section on how to add filtering rules.
-
What is the datalog? and what is it for?
The datalog is a space limited JSON based structured log of metrics and events which are optionally kept on each node.
It can be useful to diagnose issues that come up with your cluster. If you wish to use the logs yourself there's a script included to parse these logs which can be analyzed or piped into jq.Alternatively, DataStax offers free support for issues as part of our keep calm initiative and these logs can help our support engineers help diagnose your problem.
-
Will the MCAC agent work on a Mac?
No. It can be made to but it's currently only supported on Linux based OS.
Copyright DataStax, Inc.
Licensed under the Apache License, Version 2.0 (the "License"); you may not use this file except in compliance with the License. You may obtain a copy of the License at
http://www.apache.org/licenses/LICENSE-2.0
Unless required by applicable law or agreed to in writing, software distributed under the License is distributed on an "AS IS" BASIS, WITHOUT WARRANTIES OR CONDITIONS OF ANY KIND, either express or implied. See the License for the specific language governing permissions and limitations under the License.


