Code to generate the summary histogram plots of the updated Avian Conservation Assessment Database (ACAD)
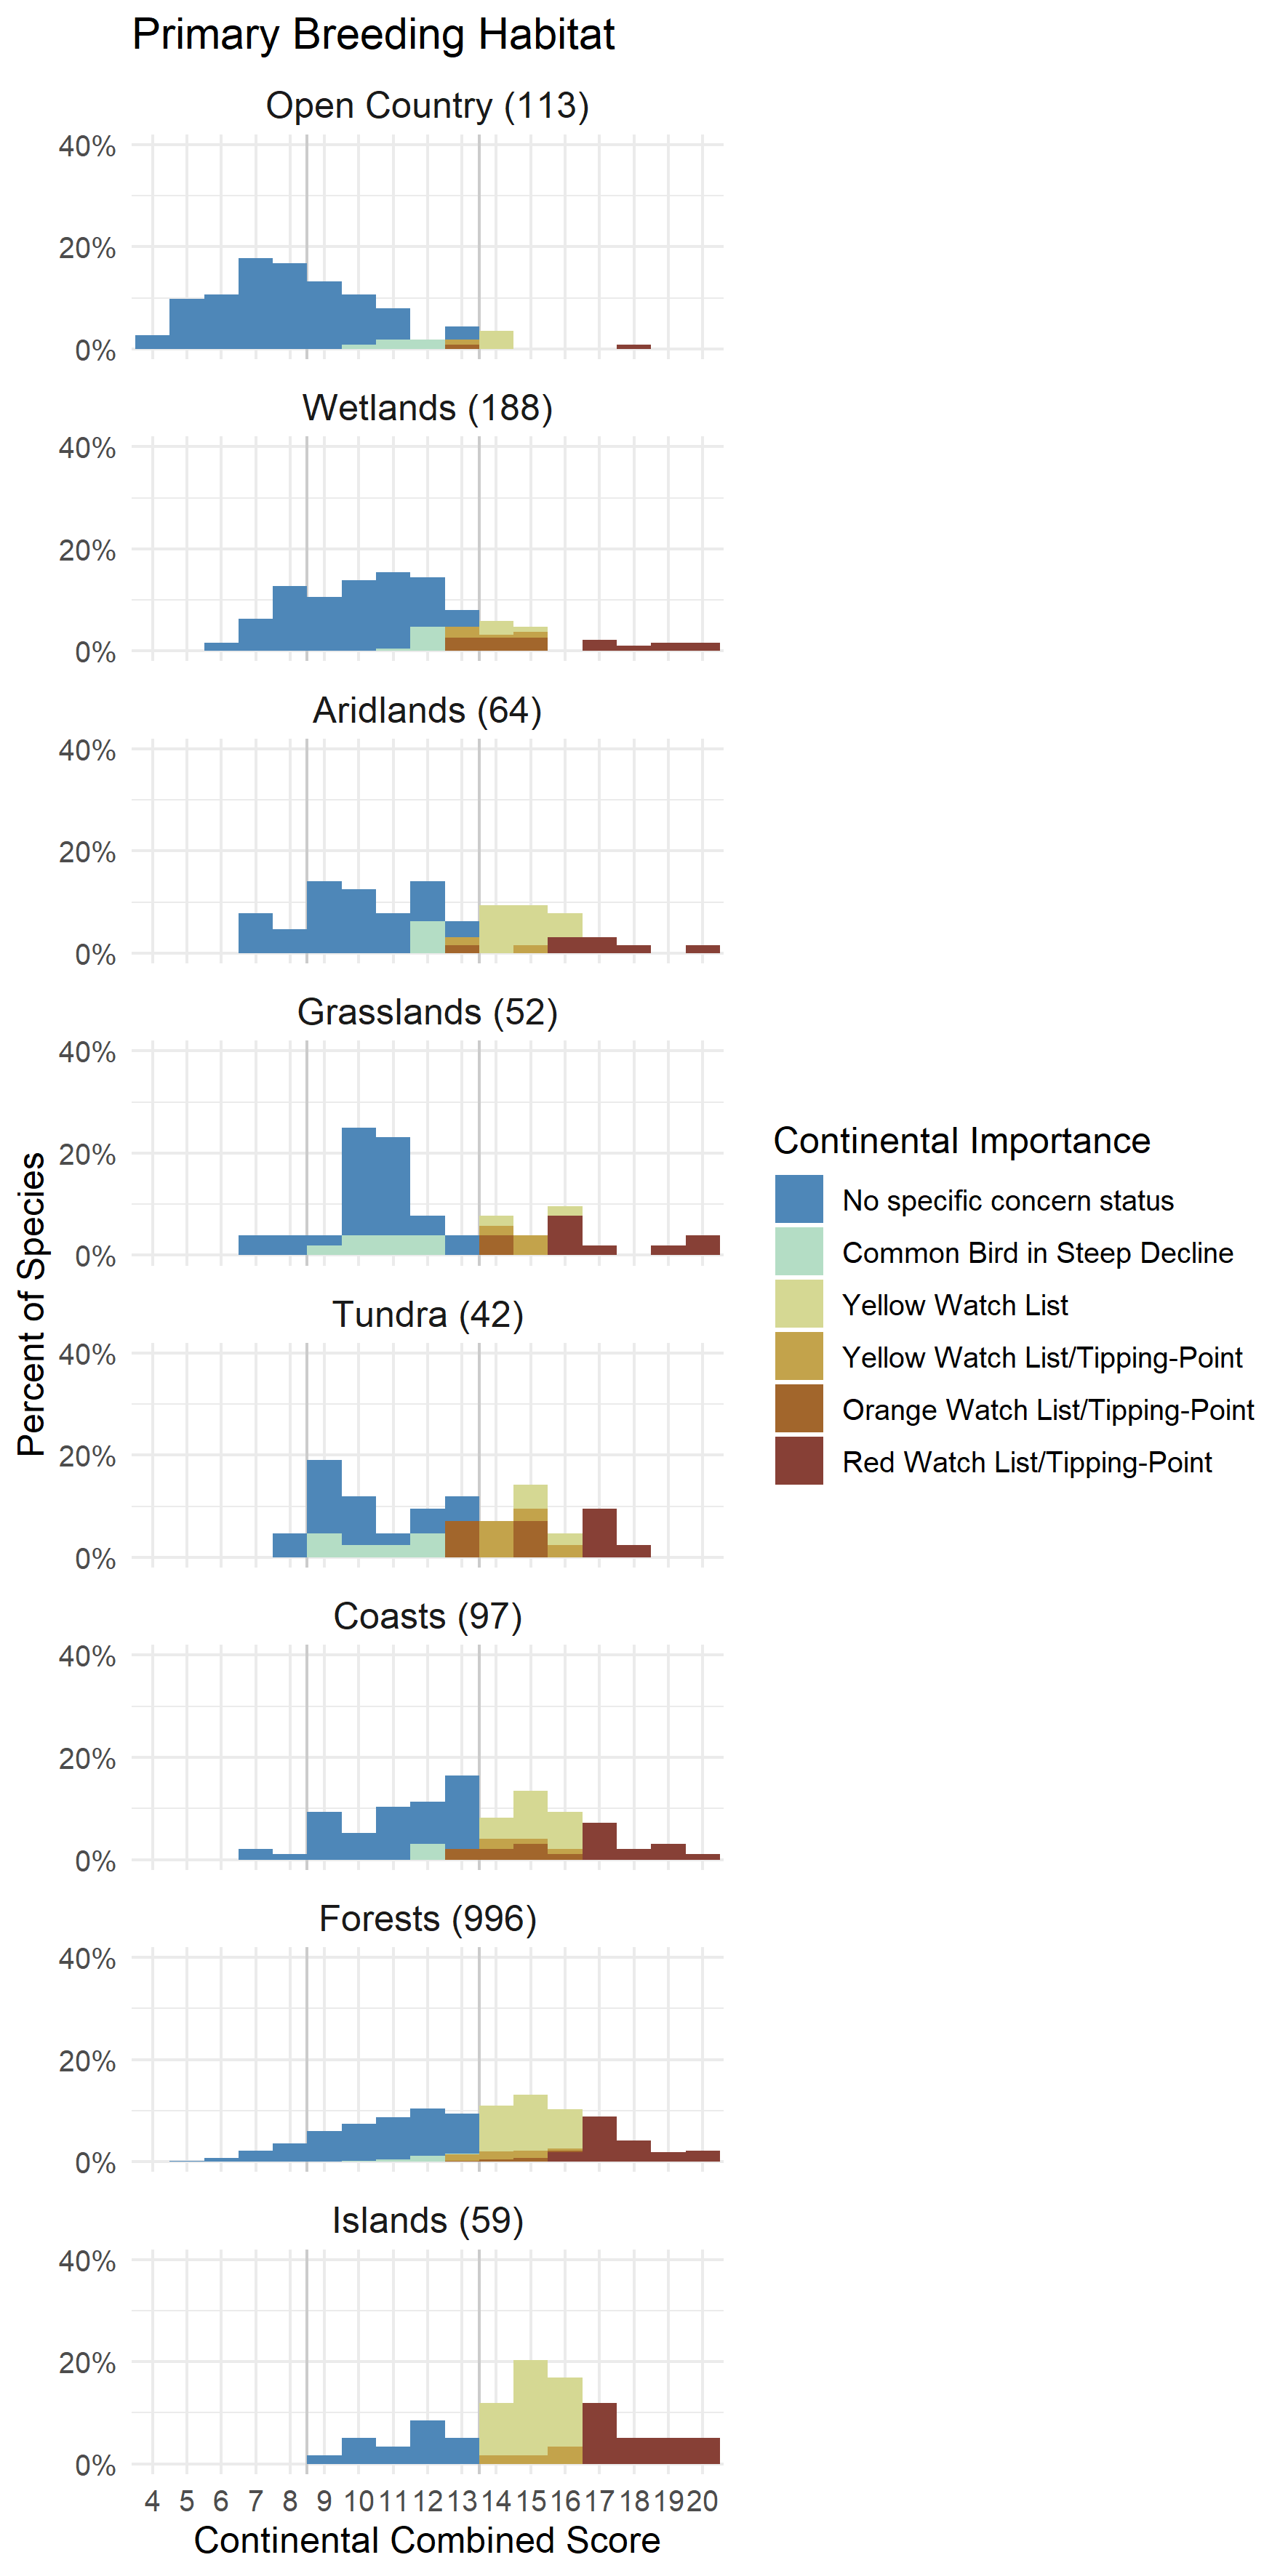
Currently just one script that outputs some draft pdfs to summarise the conservation assessments for groups of species. Produces plots like the one below showing the number of species in each assessment category for major breeding habitat categories, sorted based on the mean category across all species in the group. The colour scale reflects the continental conservation importance categories, where warmer colours represent higher risk. The palette should be interpretable for all variations of colour-vision.
