This project analyzes a dataset containing wine reviews to uncover insights into wine varieties, ratings, pricing, and geographic distribution. The goal is to answer questions such as which countries produce the most highly-rated wines, the relationship between wine points and price, and which wine varieties are most common. The analysis involves data cleansing, manipulation, and various visualization techniques to derive meaningful insights.
- Project Overview
- Dataset
- Python Script
- Data Cleansing
- Data Manipulation
- Data Analysis and Visualization
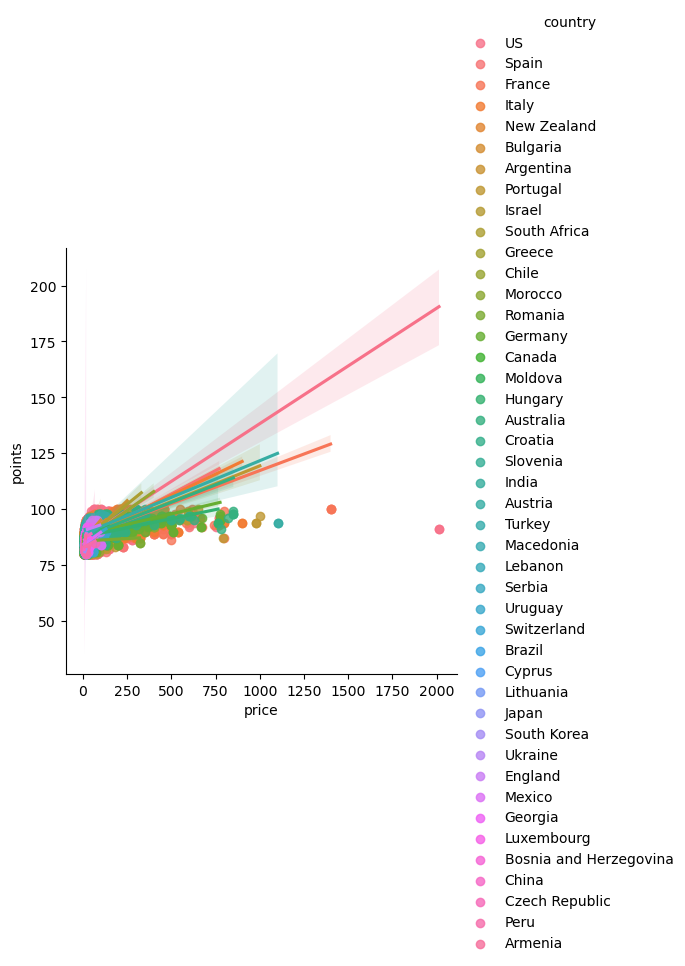
- What is the relationship between wine points and price?
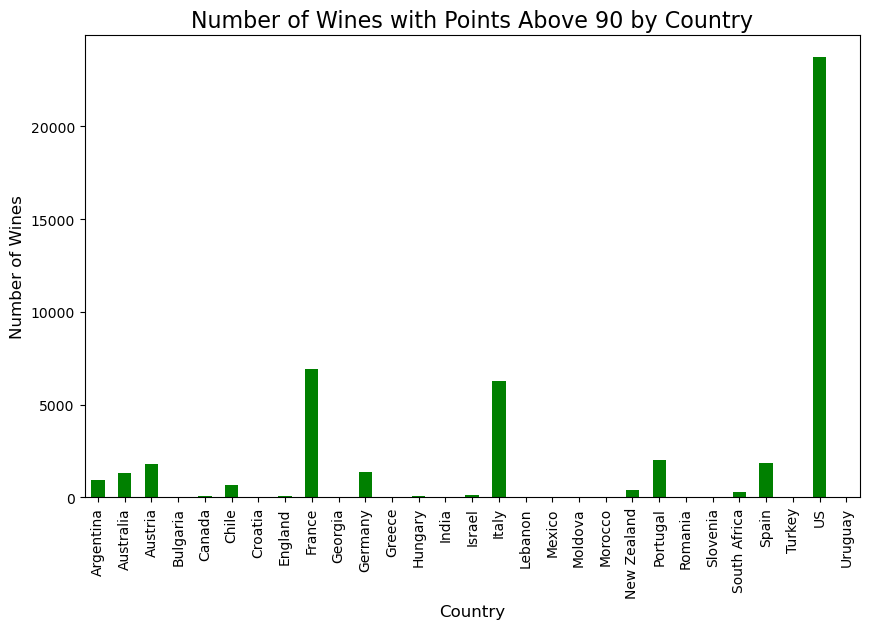
- Which country has the most highly-rated wines by points? (Showing the number of wines with points above 90 for each country).
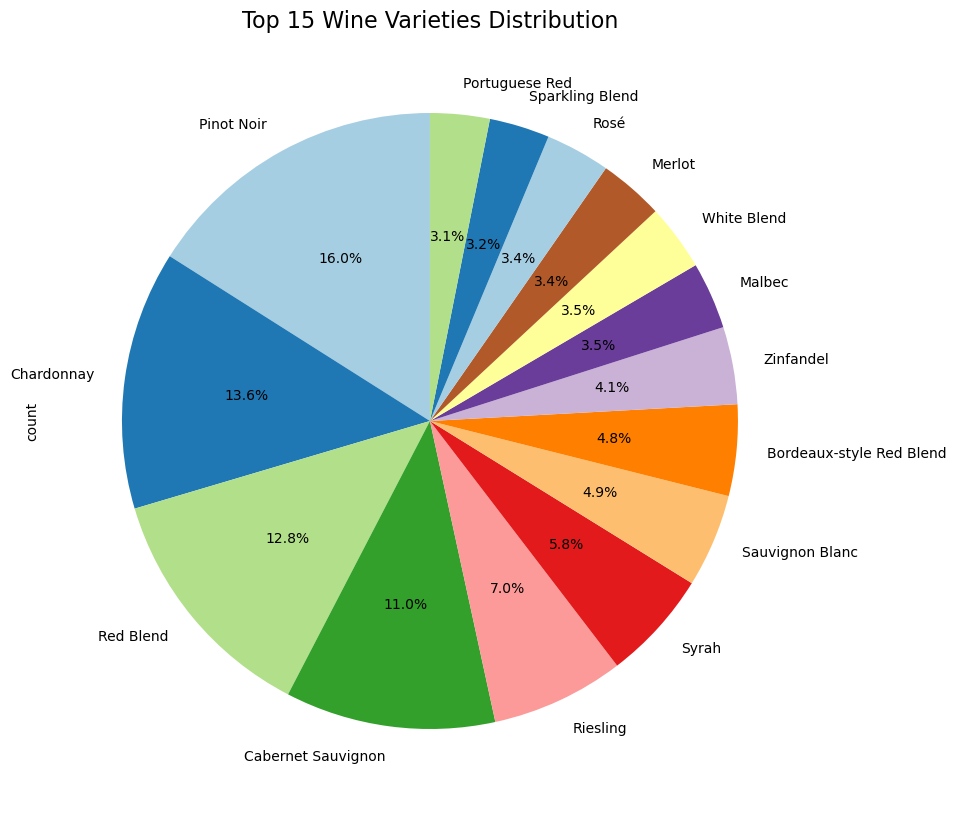
- What are the most common wine varieties in the dataset?
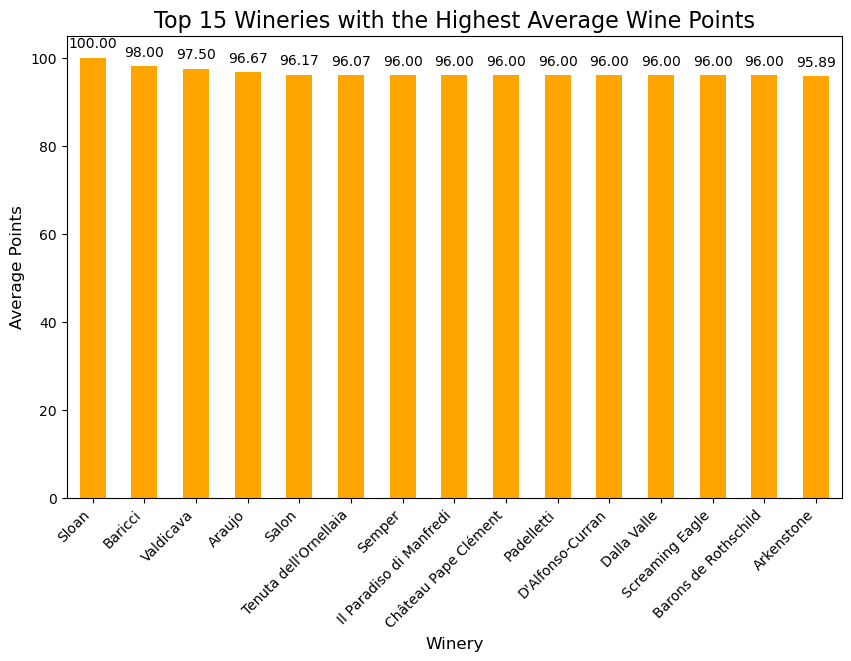
- Which wineries consistently produce the highest-rated wines?
- Is there a correlation between a wine's origin (country or province) and its price?
- Which countries or regions have the widest variety of wines?
- Tools Used
- Source: Kaggle Wine
Data cleansing is an essential step to ensure accurate and reliable analysis. The key cleansing tasks included:
- Removing duplicates: Ensuring no repeated data entries in the dataset.
- Handling missing values: Imputing or removing entries with missing information, such as missing prices or points.
- Correcting data types: Standardizing columns like country and price for consistency.
Data Manipulation Data manipulation transforms the raw data into a more useful format for analysis. Key data manipulation steps in this project included:
- Aggregating wine varieties by country: Grouping data to calculate the number of wine varieties per country.
- Calculating average wine prices: Summarizing the pricing data to identify trends.
- Creating new features: Such as filtering wines by points (above 90) to focus on high-quality wines.
Description: This scatter plot shows the relationship between a wine's rating (points) and its price.
- Insight: Wines with higher points tend to have higher prices but there are some high-quality wines available at a lower price point.
Which country has the most highly-rated wines by points? (Showing the number of wines with points above 90 for each country.)
Description: This bar chart highlights which countries produce the most wines with points above 90.
- Insight: Countries like France, Italy, and Spain lead in producing high-rated wines. This can be attributed to their long history of winemaking and diverse grape varieties.
Description: A pie chart representing the distribution of different wine varieties across the dataset.
- Insight: Popular varieties include Cabernet Sauvignon, Chardonnay, Red Blend and Pinot Noir. With these varieties being widely grown across major wine-producing countries.
Description: This bar chart highlights which wineries produce high-rated wines.
- Insight: The bar chart ranks the top 15 wineries based on their average wine points with Sloan leading the list followed by Baricci and Valdicava.
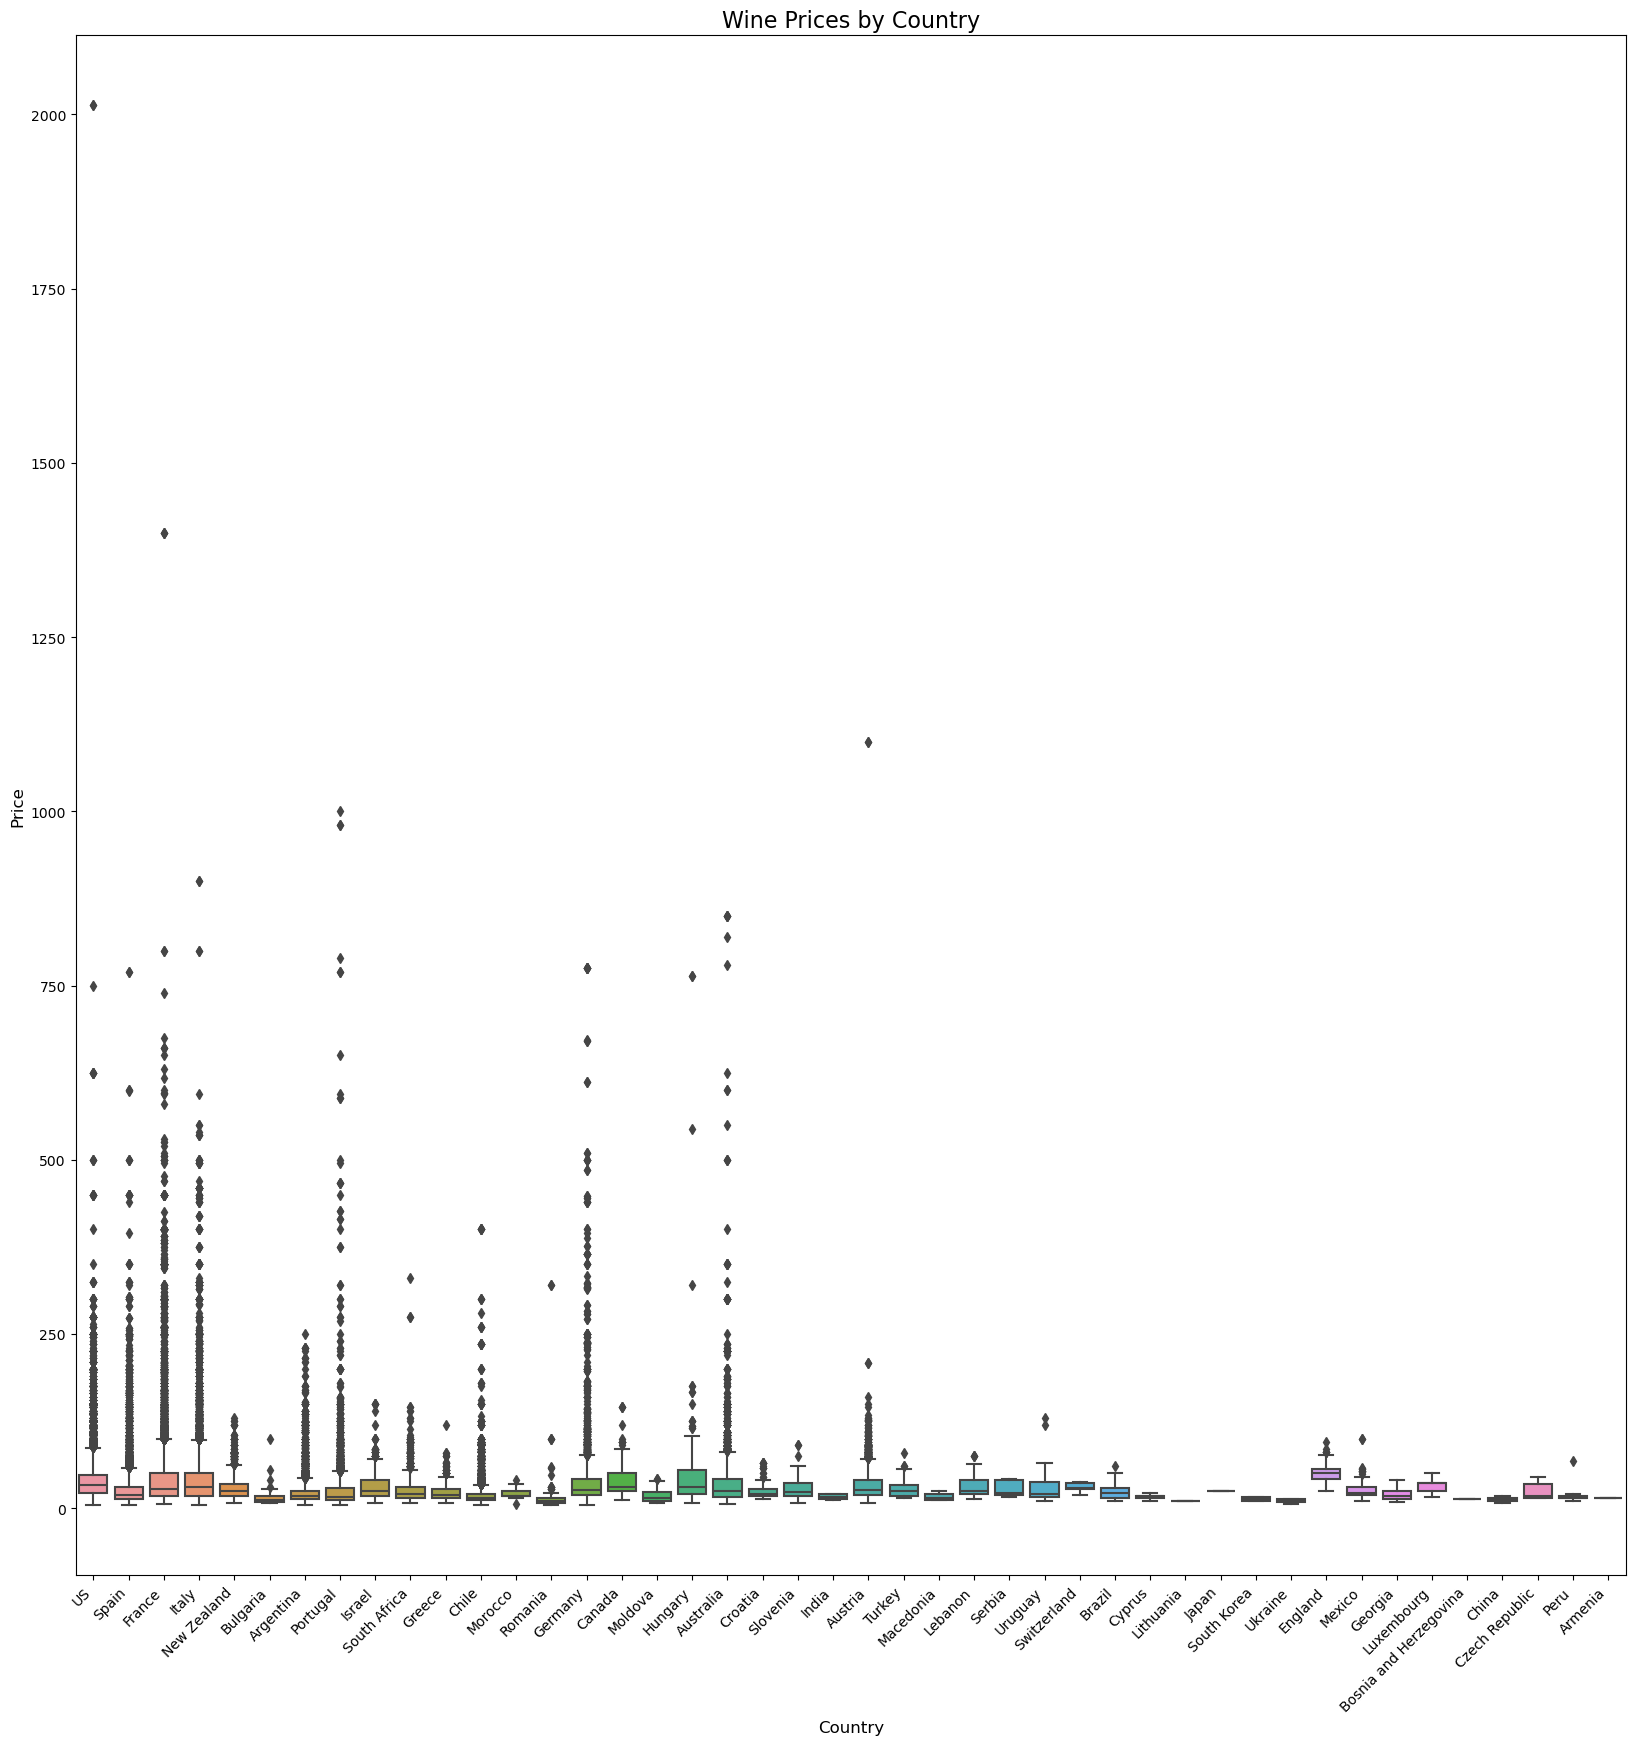
Description: A box plot showing the price distribution of wines based on their country of origin.
-
Wide Price Range: Some countries such as France, Italy, and Spain. They show a wide range of wine prices as seen by the height of the boxes and whiskers. These countries also have several high-price outliers like France has some very high-priced outliers above $1000.
-
Outliers: Countries like Greece, Germany, Israel, and New Zealand show distinct outliers. Indicating that a few wines from these countries are significantly more expensive than the majority.
-
Concentrated Price Range: Many countries have a relatively small range of wine prices such as Argentina, Australia, Chile, and South Africa. These countries have smaller boxes and fewer outliers meaning their wine prices tend to be more consistent.
-
Affordability: Countries like Portugal, Romania, Slovenia, and Turkey show much lower prices with the majority of wines priced in a narrow lower range compared to countries like France or Italy.
-
Countries with High-Price Wines: The chart shows that France, Italy, Spain, and the US have some of the highest-priced wines with several outliers reaching well above the typical range of prices.
Conclusion: France stands out for having the most diverse and expensive range of wine prices with some wines priced extraordinarily high. Many countries such as Argentina, Australia, and South Africa have a more concentrated price range with fewer outliers. Some countries offer more affordable wine options while others (especially France and Italy) can be associated with luxury or high-end wine products.
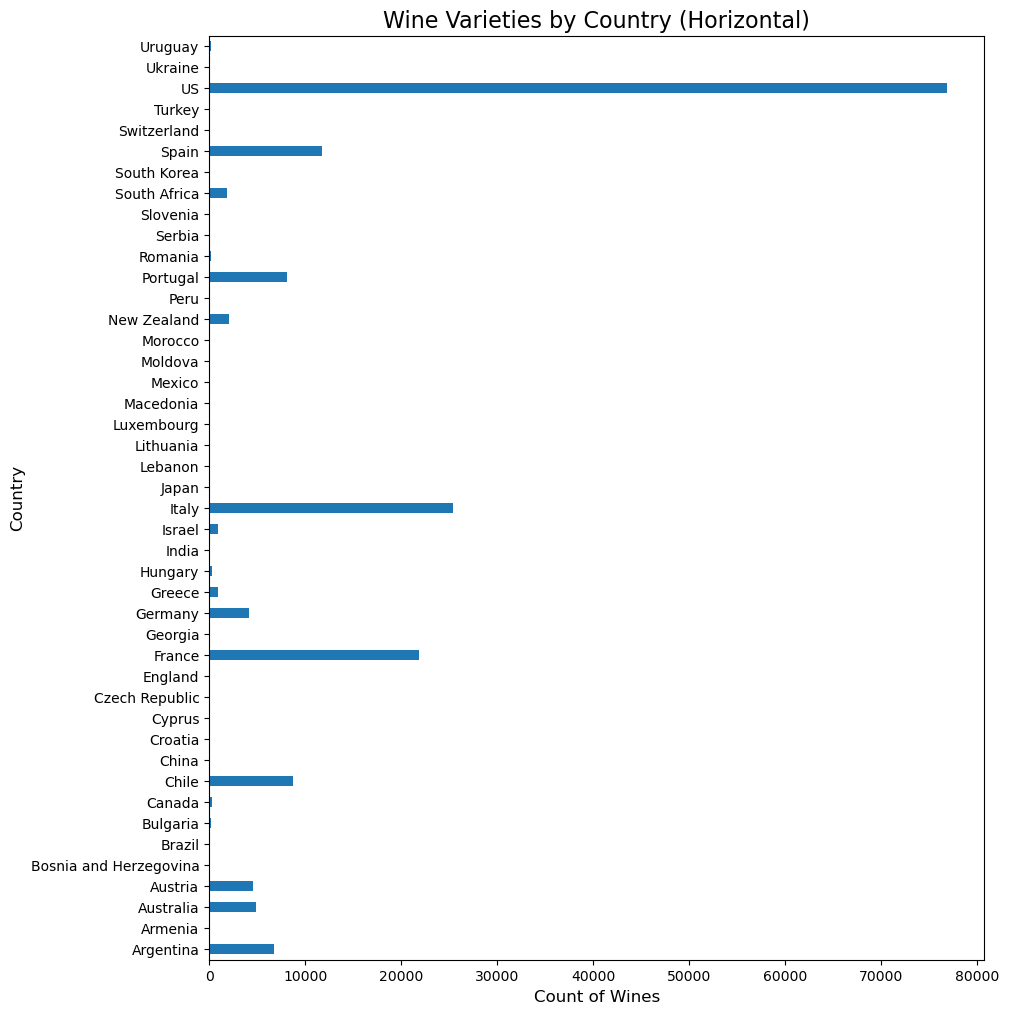
Description: A horizontal bar chart showing the number of wine varieties produced by each country.
- The bar chart shows the number of wine varieties produced in different countries with the United States having the highest number of varieties followed by France and Spain.
This project utilized the following tools and libraries:
- Python: Programming language used for data analysis
- Pandas: For data manipulation and analysis
- Matplotlib: For creating static visualizations
- Seaborn: For statistical data visualization
- Jupyter Notebook: For interactive coding and visualization
