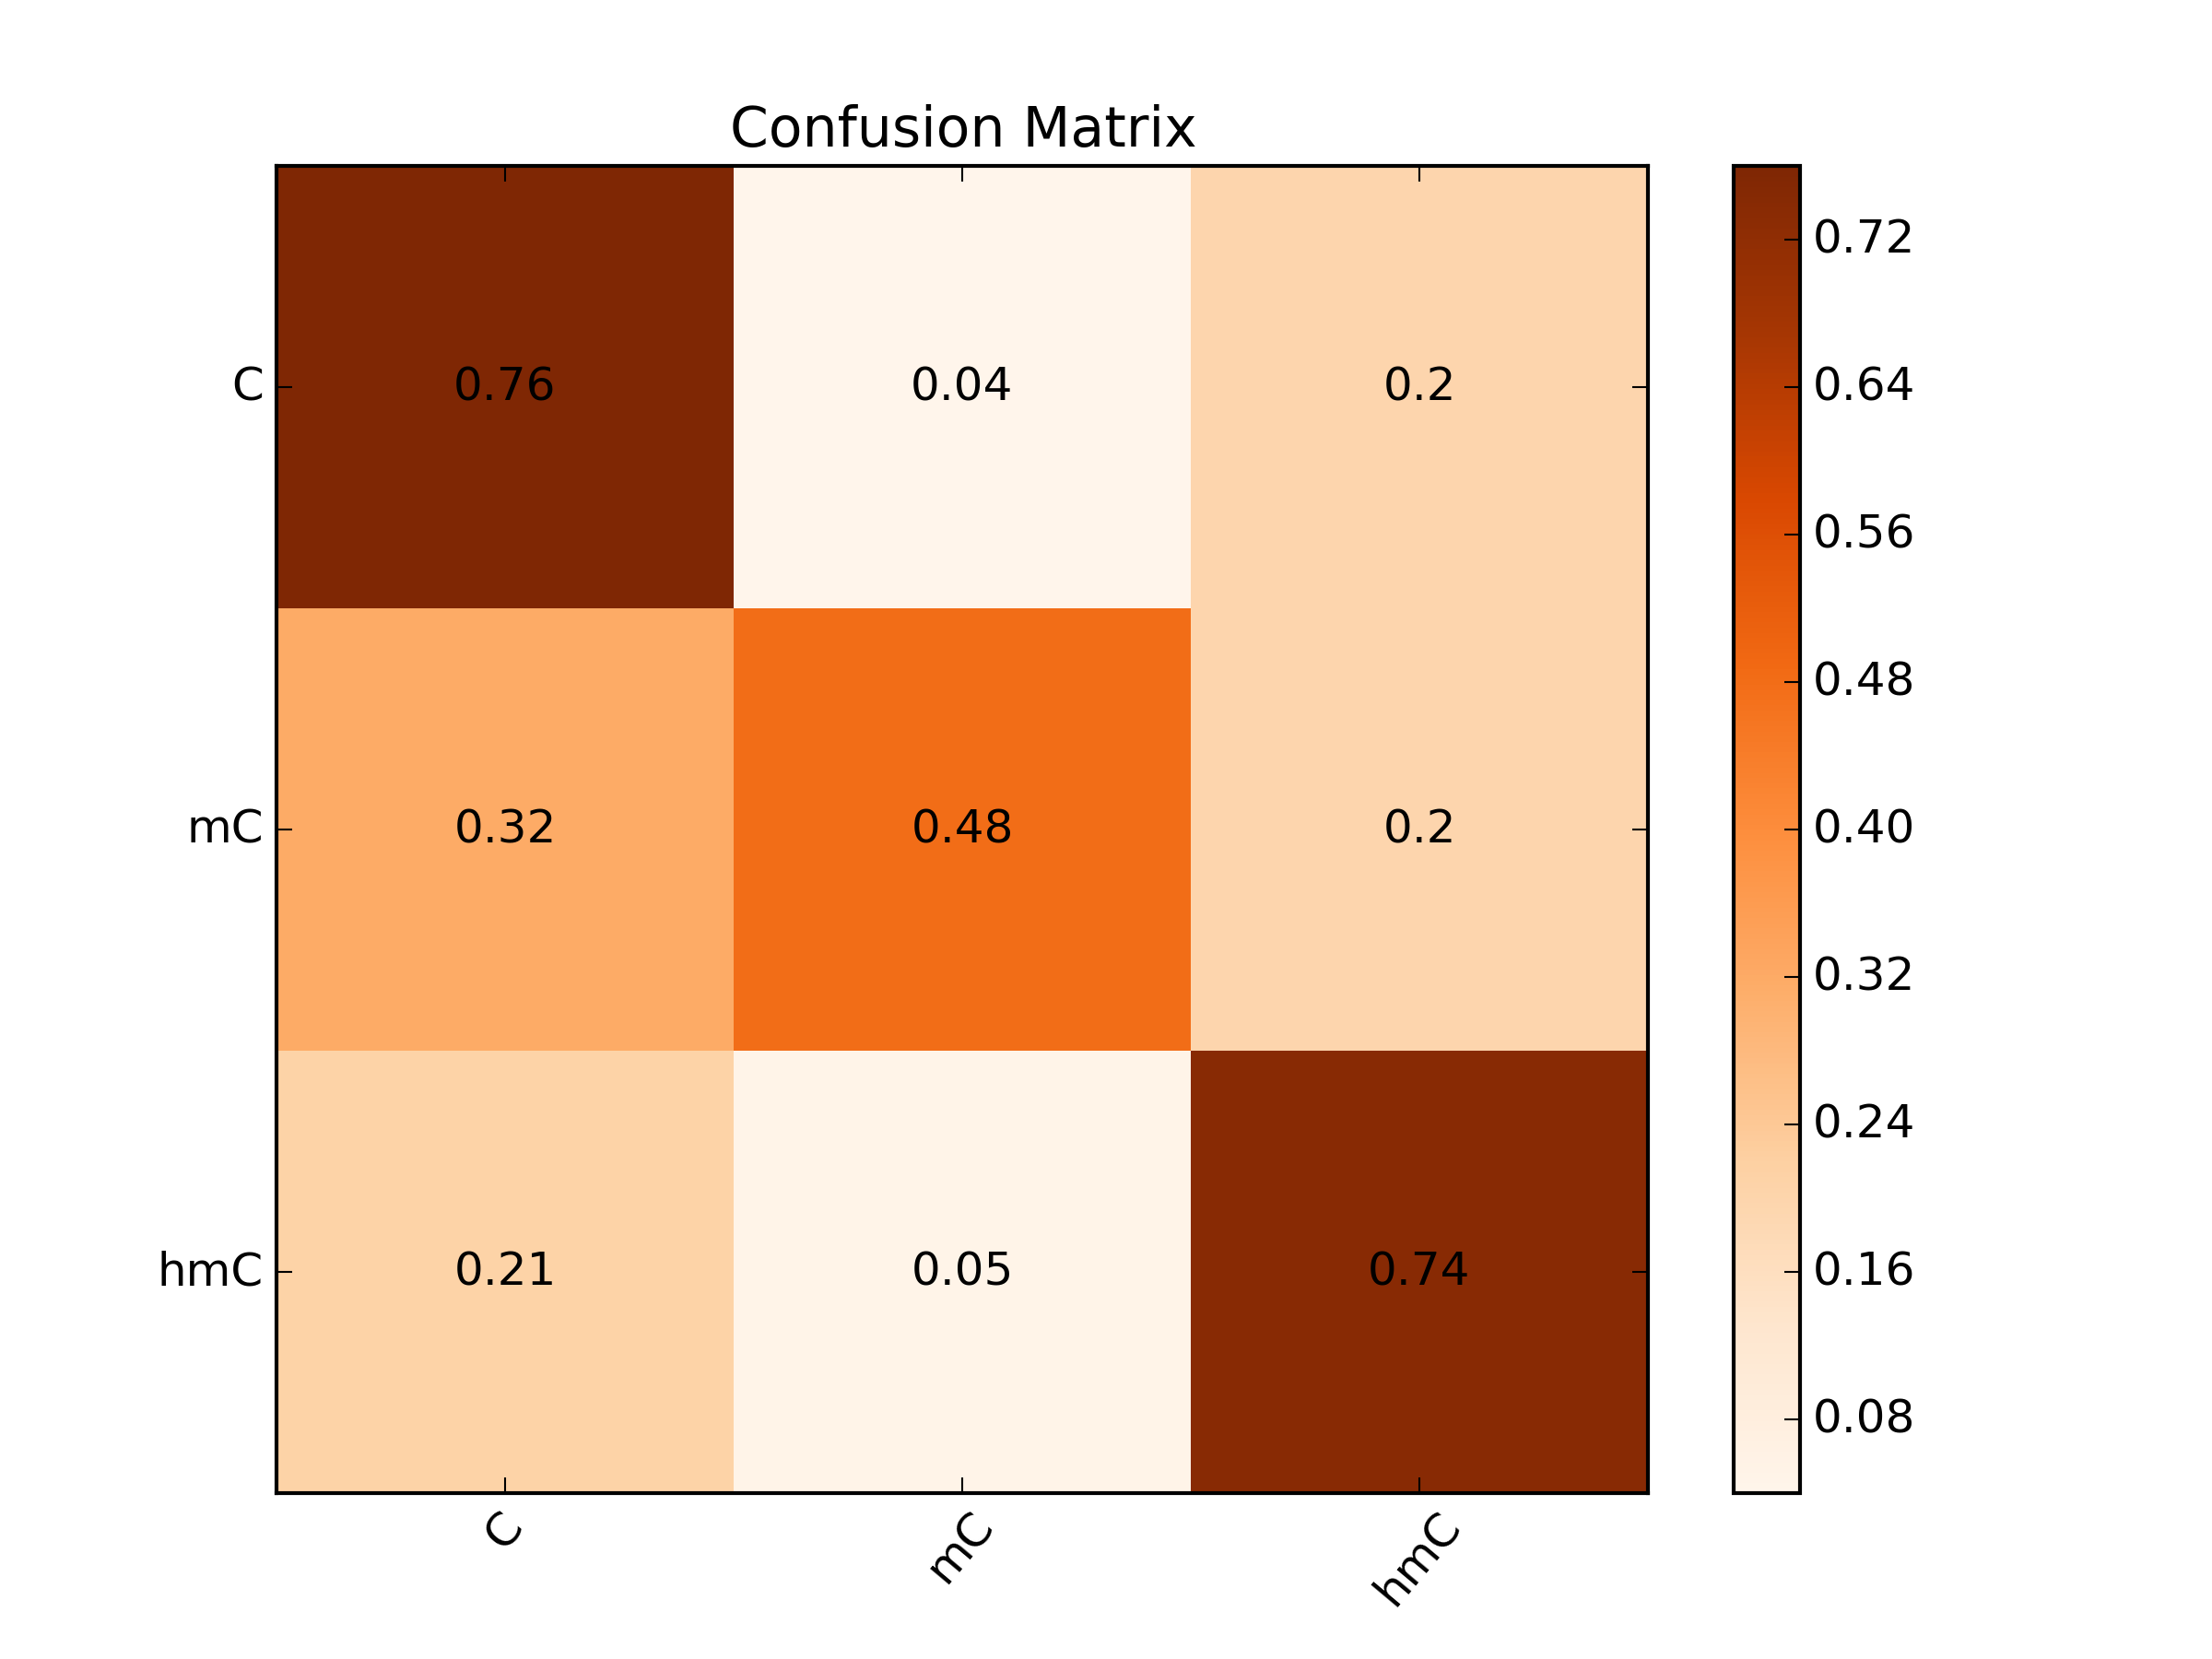
Hypothesis being tested: Will additional "reads" provided by a nanopore reread system reduce the error rate of calling epigenetic modifications?
These steps were tested in both a Linux/OSx and Windows environment using Docker: https://docs.docker.com/installation/
docker pull jvivian/reread
docker run -v [output path]:/data jvivian/reread python events_by_cutoff_plot.py
docker run -v [output path]:/data jvivian/reread python accuracy_SR_MR_plot.py
[output path] must be an absolute host path, i.e.:
docker run -v /Users/Jvivian/Desktop:/data jvivian/reread python events_by_cutoff_plot.py
If using Windows, the absolute path must be given as:
docker run -v /c/Users/Jvivian/Desktop:/data jvivian/reread python events_by_cutoff_plot.py
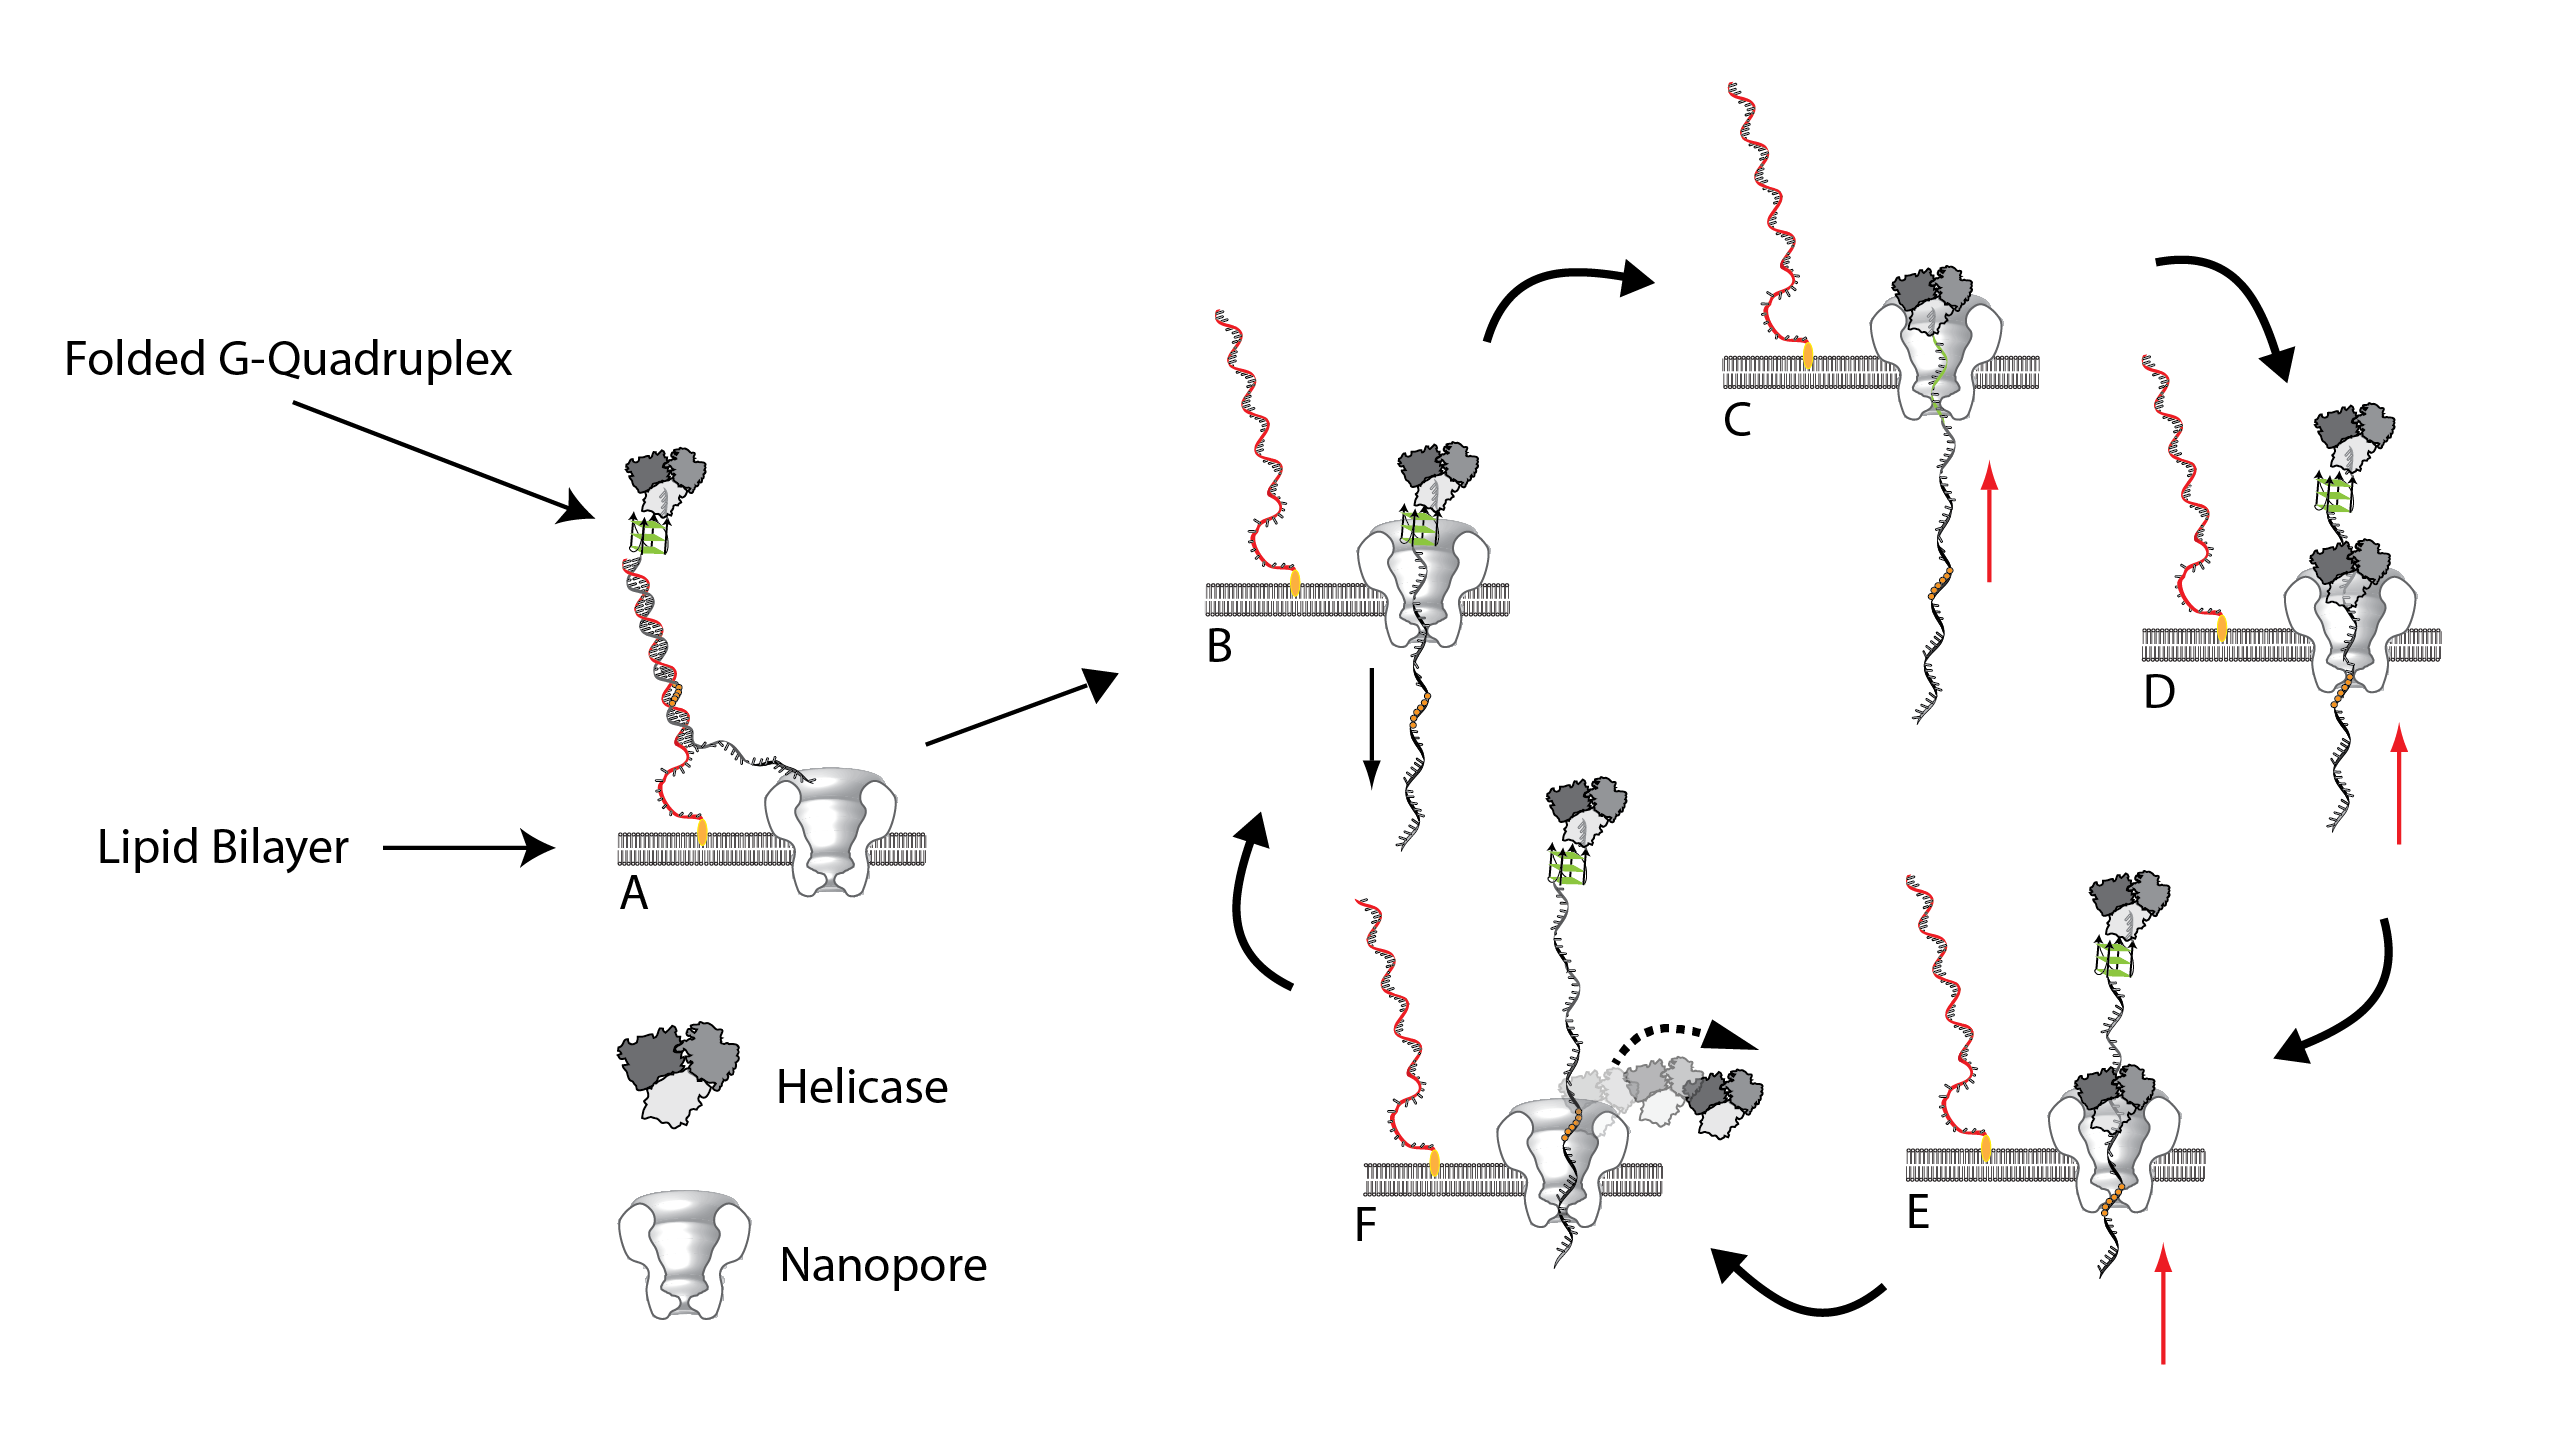 A: Substrate bound to the lipid bilayer via a cholesterol tag with a helicase (Hel308) bound and inactive at the other end. B: Electric potential causes the DNA duplex to unwind, leaving behind the cholesterol tether bound to the complement strand. C: Electric potential and the steady-state nature of the G-Quadruplex (GQ) causes it to unfold allowing the helicase to become enzymatically active in the 3' -> 5' direction. D: As Hel308 translocates the DNA back up through the pore, the GQ will refold allowing an additional enzyme to become bound. E: Continued translocation. F: More than 3-4 abasic residues causes Hel308 to dissociate from the substrate (9 are used in the substrate). The DNA strand is then pulled back down and the cycle is able to repeat itself once more.
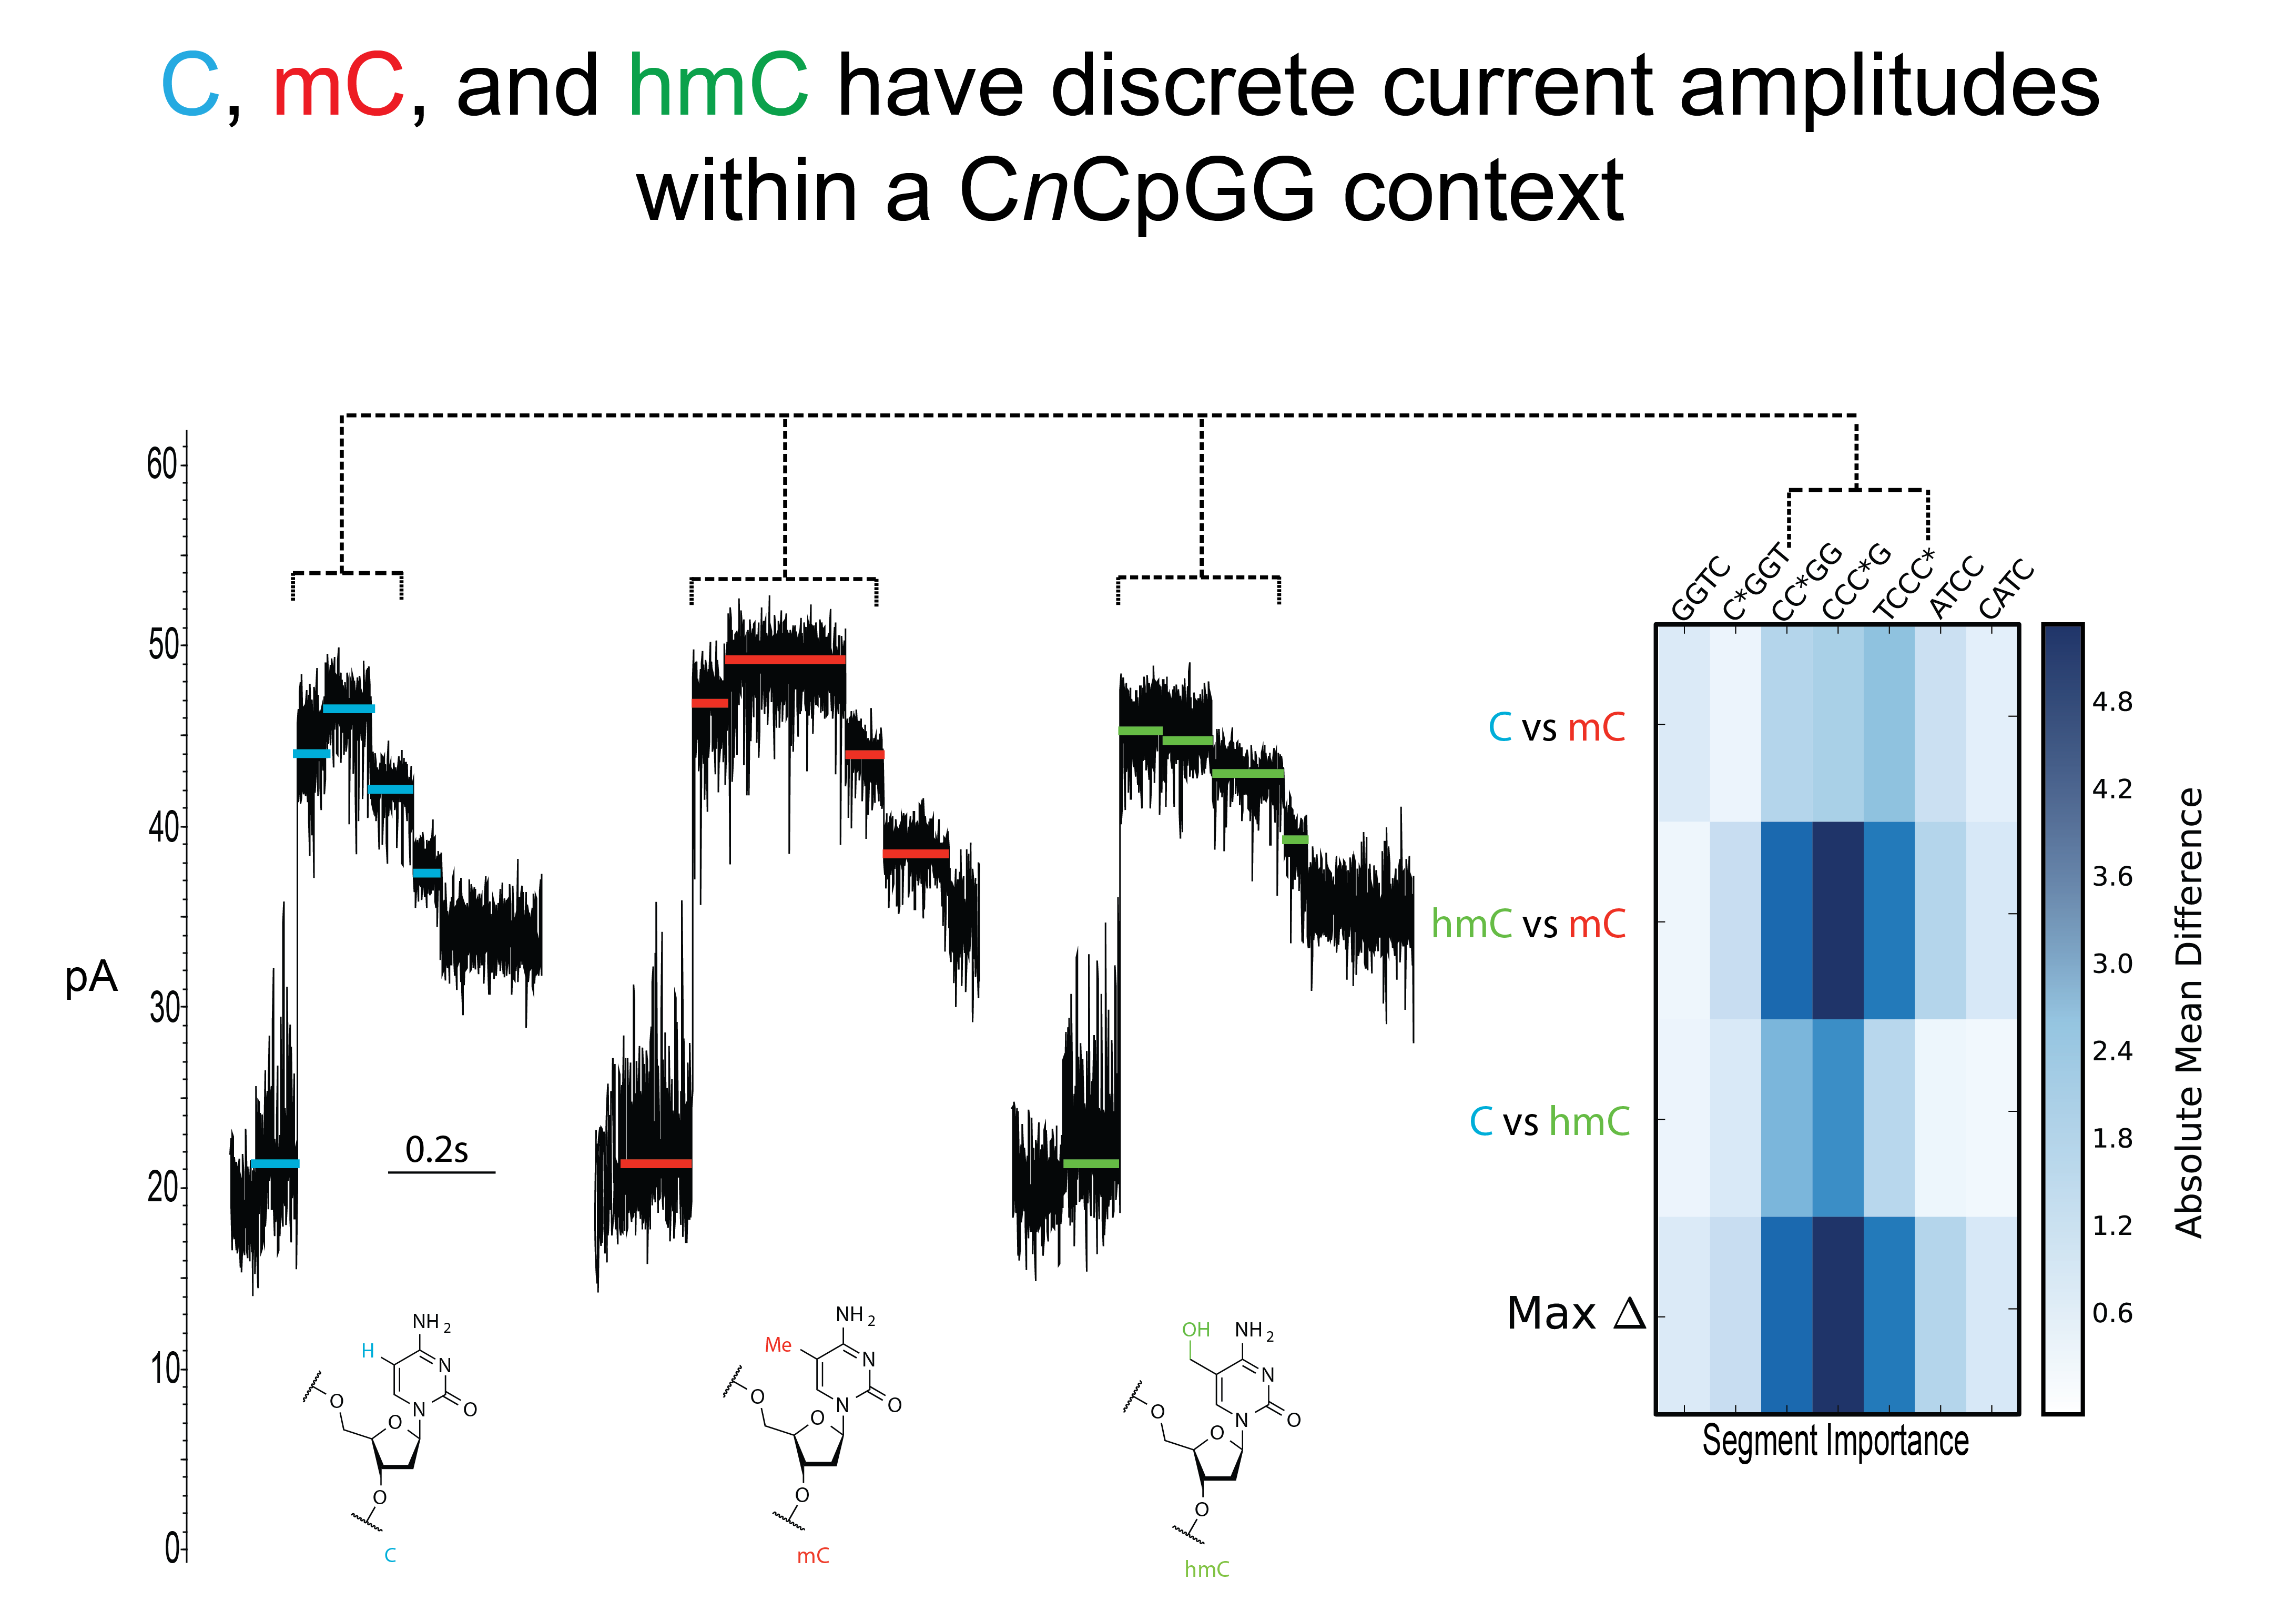 A subsection of 3 current traces in the context region highlight how the different epigenetic modifications affect the amplitude of the current. A heatmap was constructed to highlight the differences (pA) that exist between the 4-mers in the modified context region.
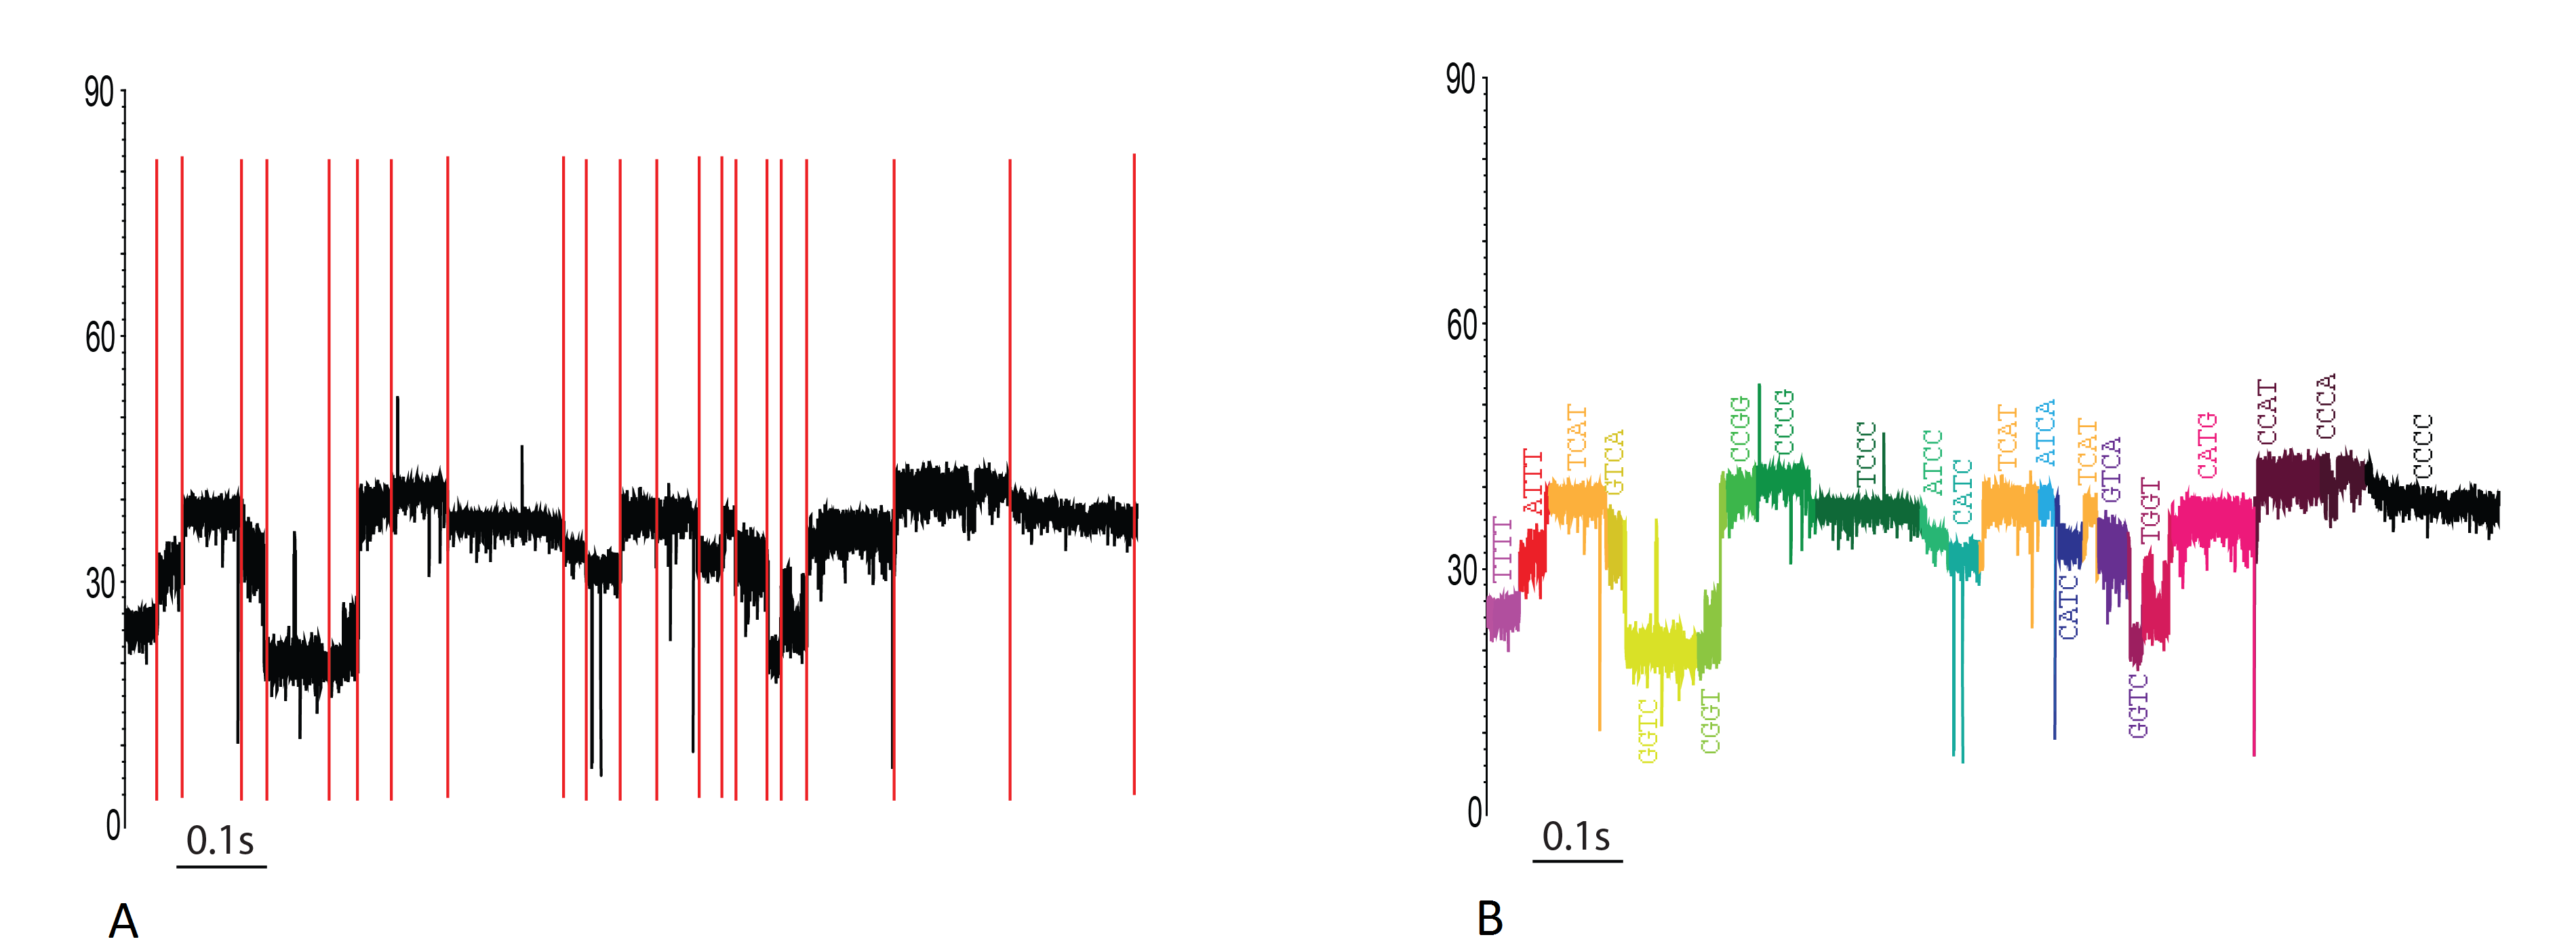 A: A current trace of a single event with three distinct reads. The coloring scheme is a 4-color cycle that indicates how the segmenter divided up the current trace. The high amplitude states (80pA) are the result of abasic residues passing through the pore. B: The same trace as A, but colored by HMM state (black segments represent insert states [noise/off-pathway segments]). This figure helps give a visual representation to how a set of observations are aligned to the HMM.
[Left] A modular `board' in the HMM representative of a specific current mean (segment) in a nanopore trace. Circular nodes represent silent states (non-emitting states), D is the delete state (missing segment), I is the insert state (off-pathway segment/noise spikes), M is the match state (aligning to a segment of the same mean), and the red states represent the backslip pathway. [Right] A graph showing the probability of a backslip at differing lengths given transition probabilities.
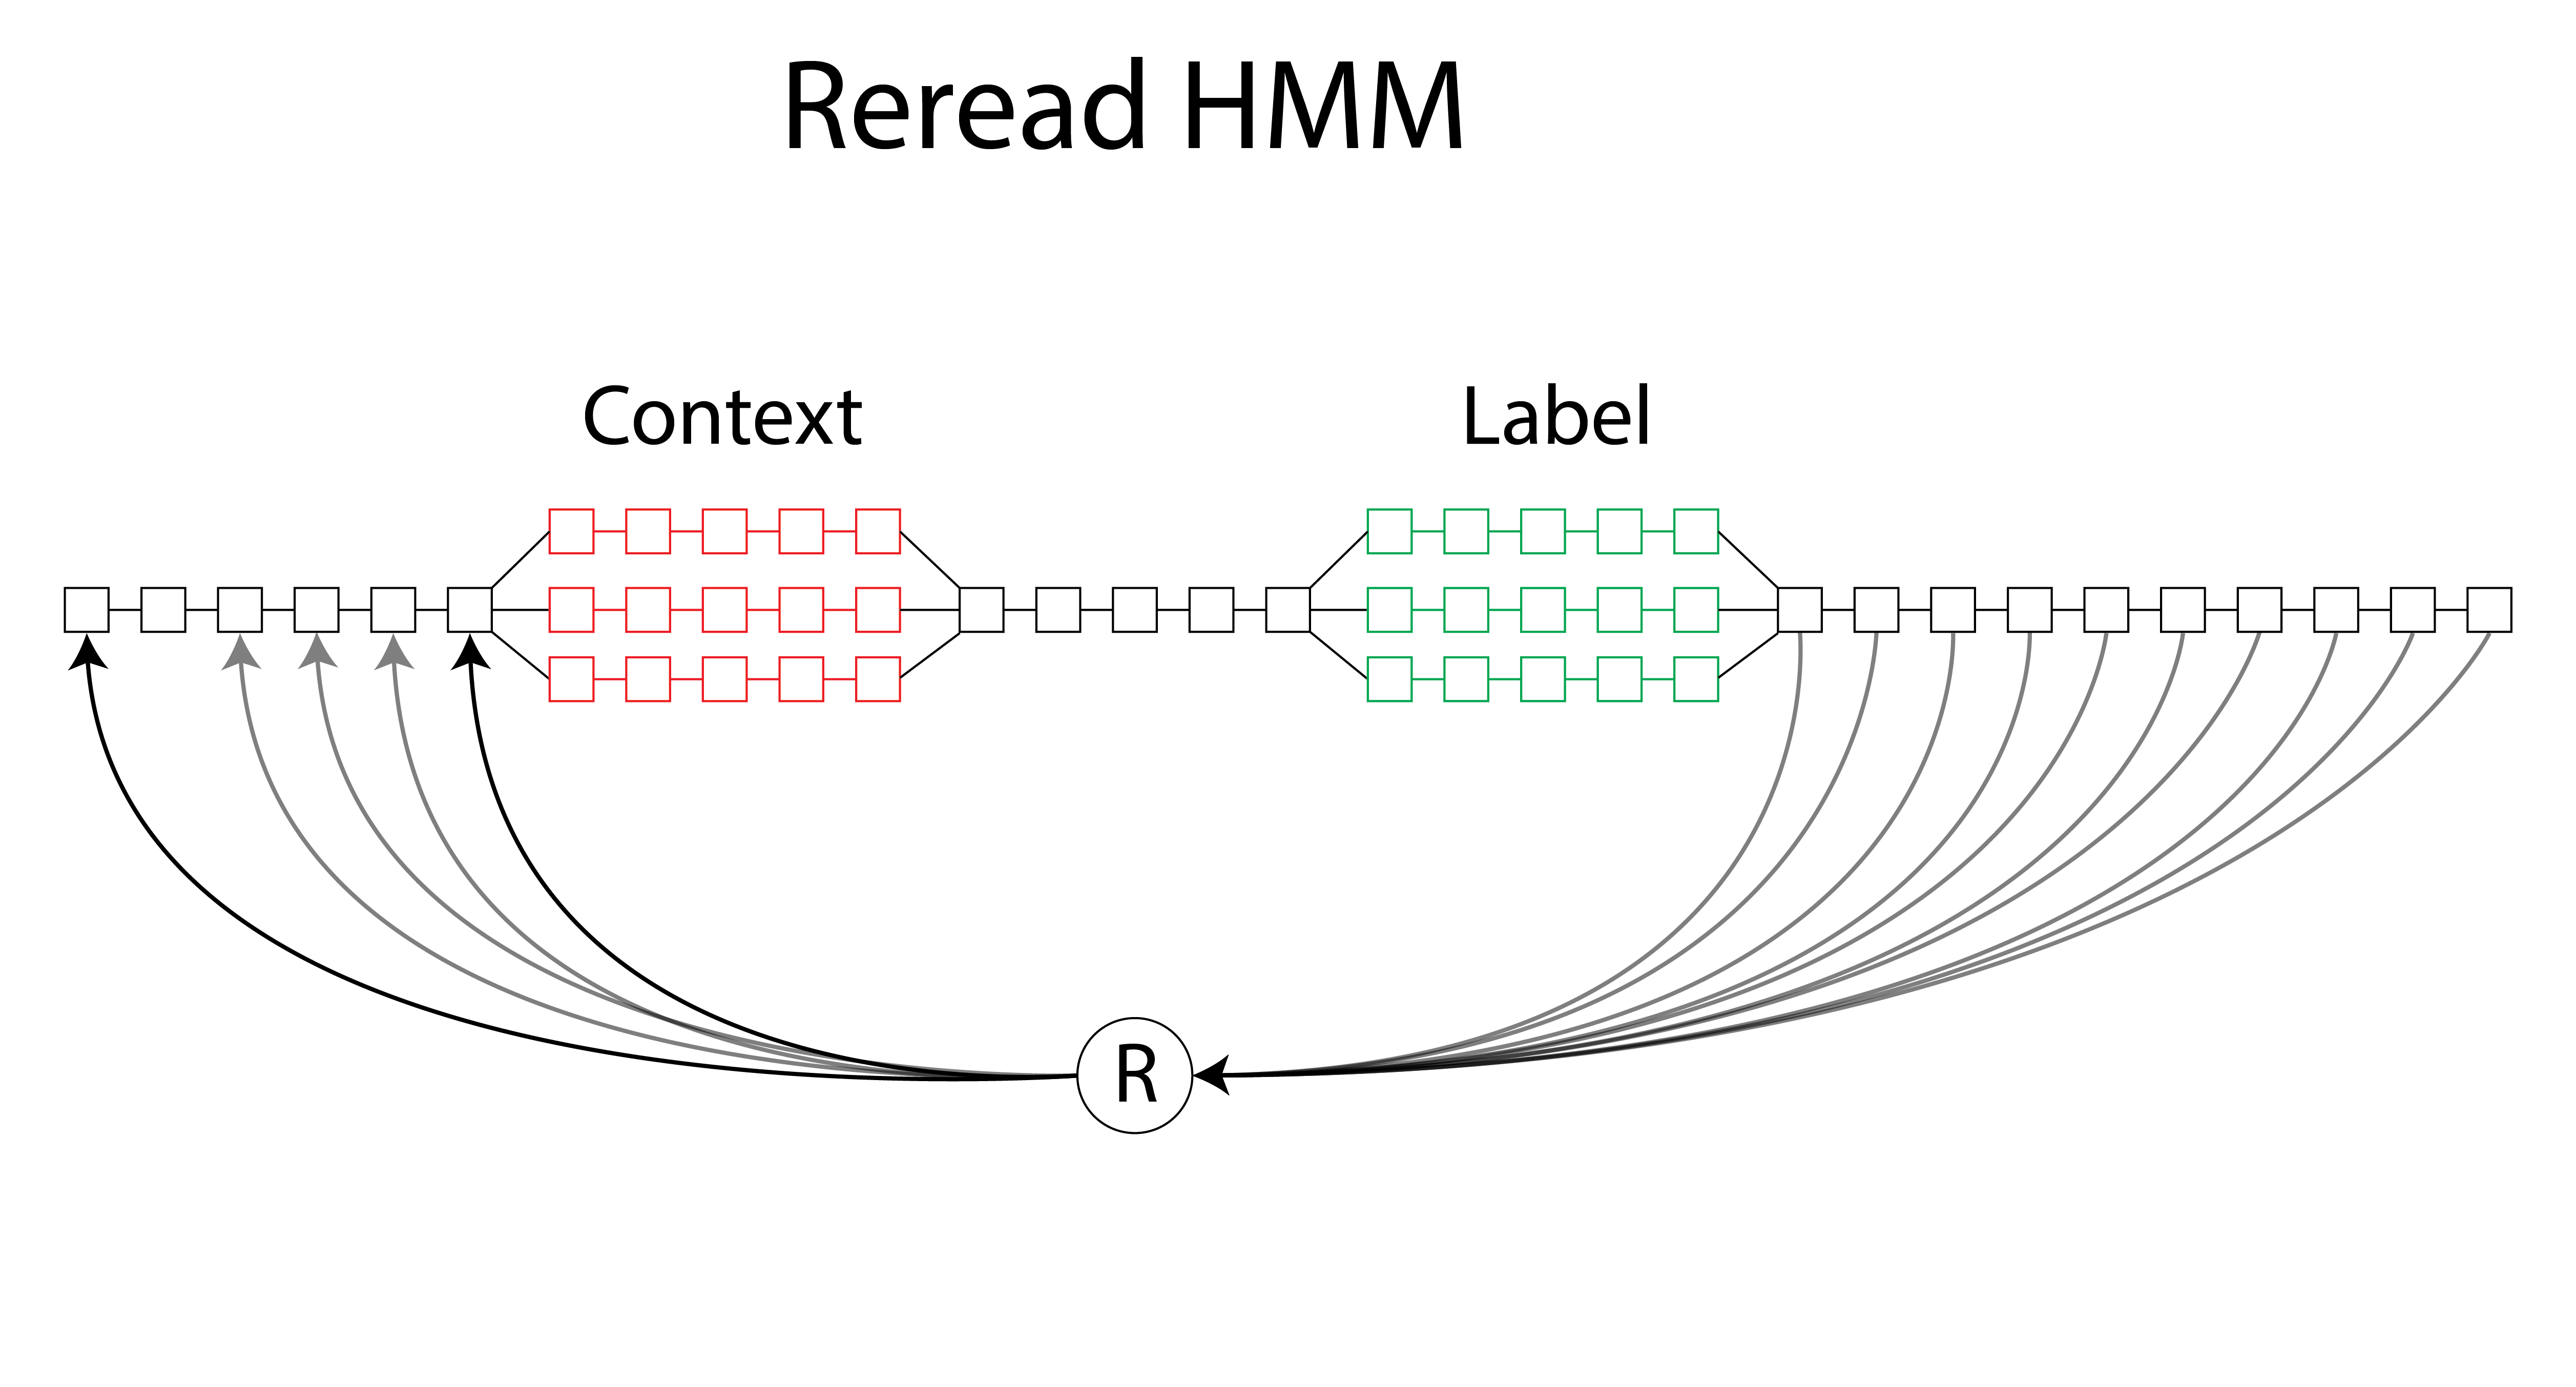 The metastructure of the complete profile HMM used in this analysis. Each box corresponds to the modular board depicted in the previous figure. The forks for the context and the label region allow each substrate to be aligned to their own track in the fork based on their respective amplitudes. The linear portions of the structure represent the consensus in amplitude that exists between the strands omitting the 10 states perturbed by the context and label region. In order to handle alignment of the molecules that are reread, transition edges exist after the label that transition to one of the beginning states in the model.
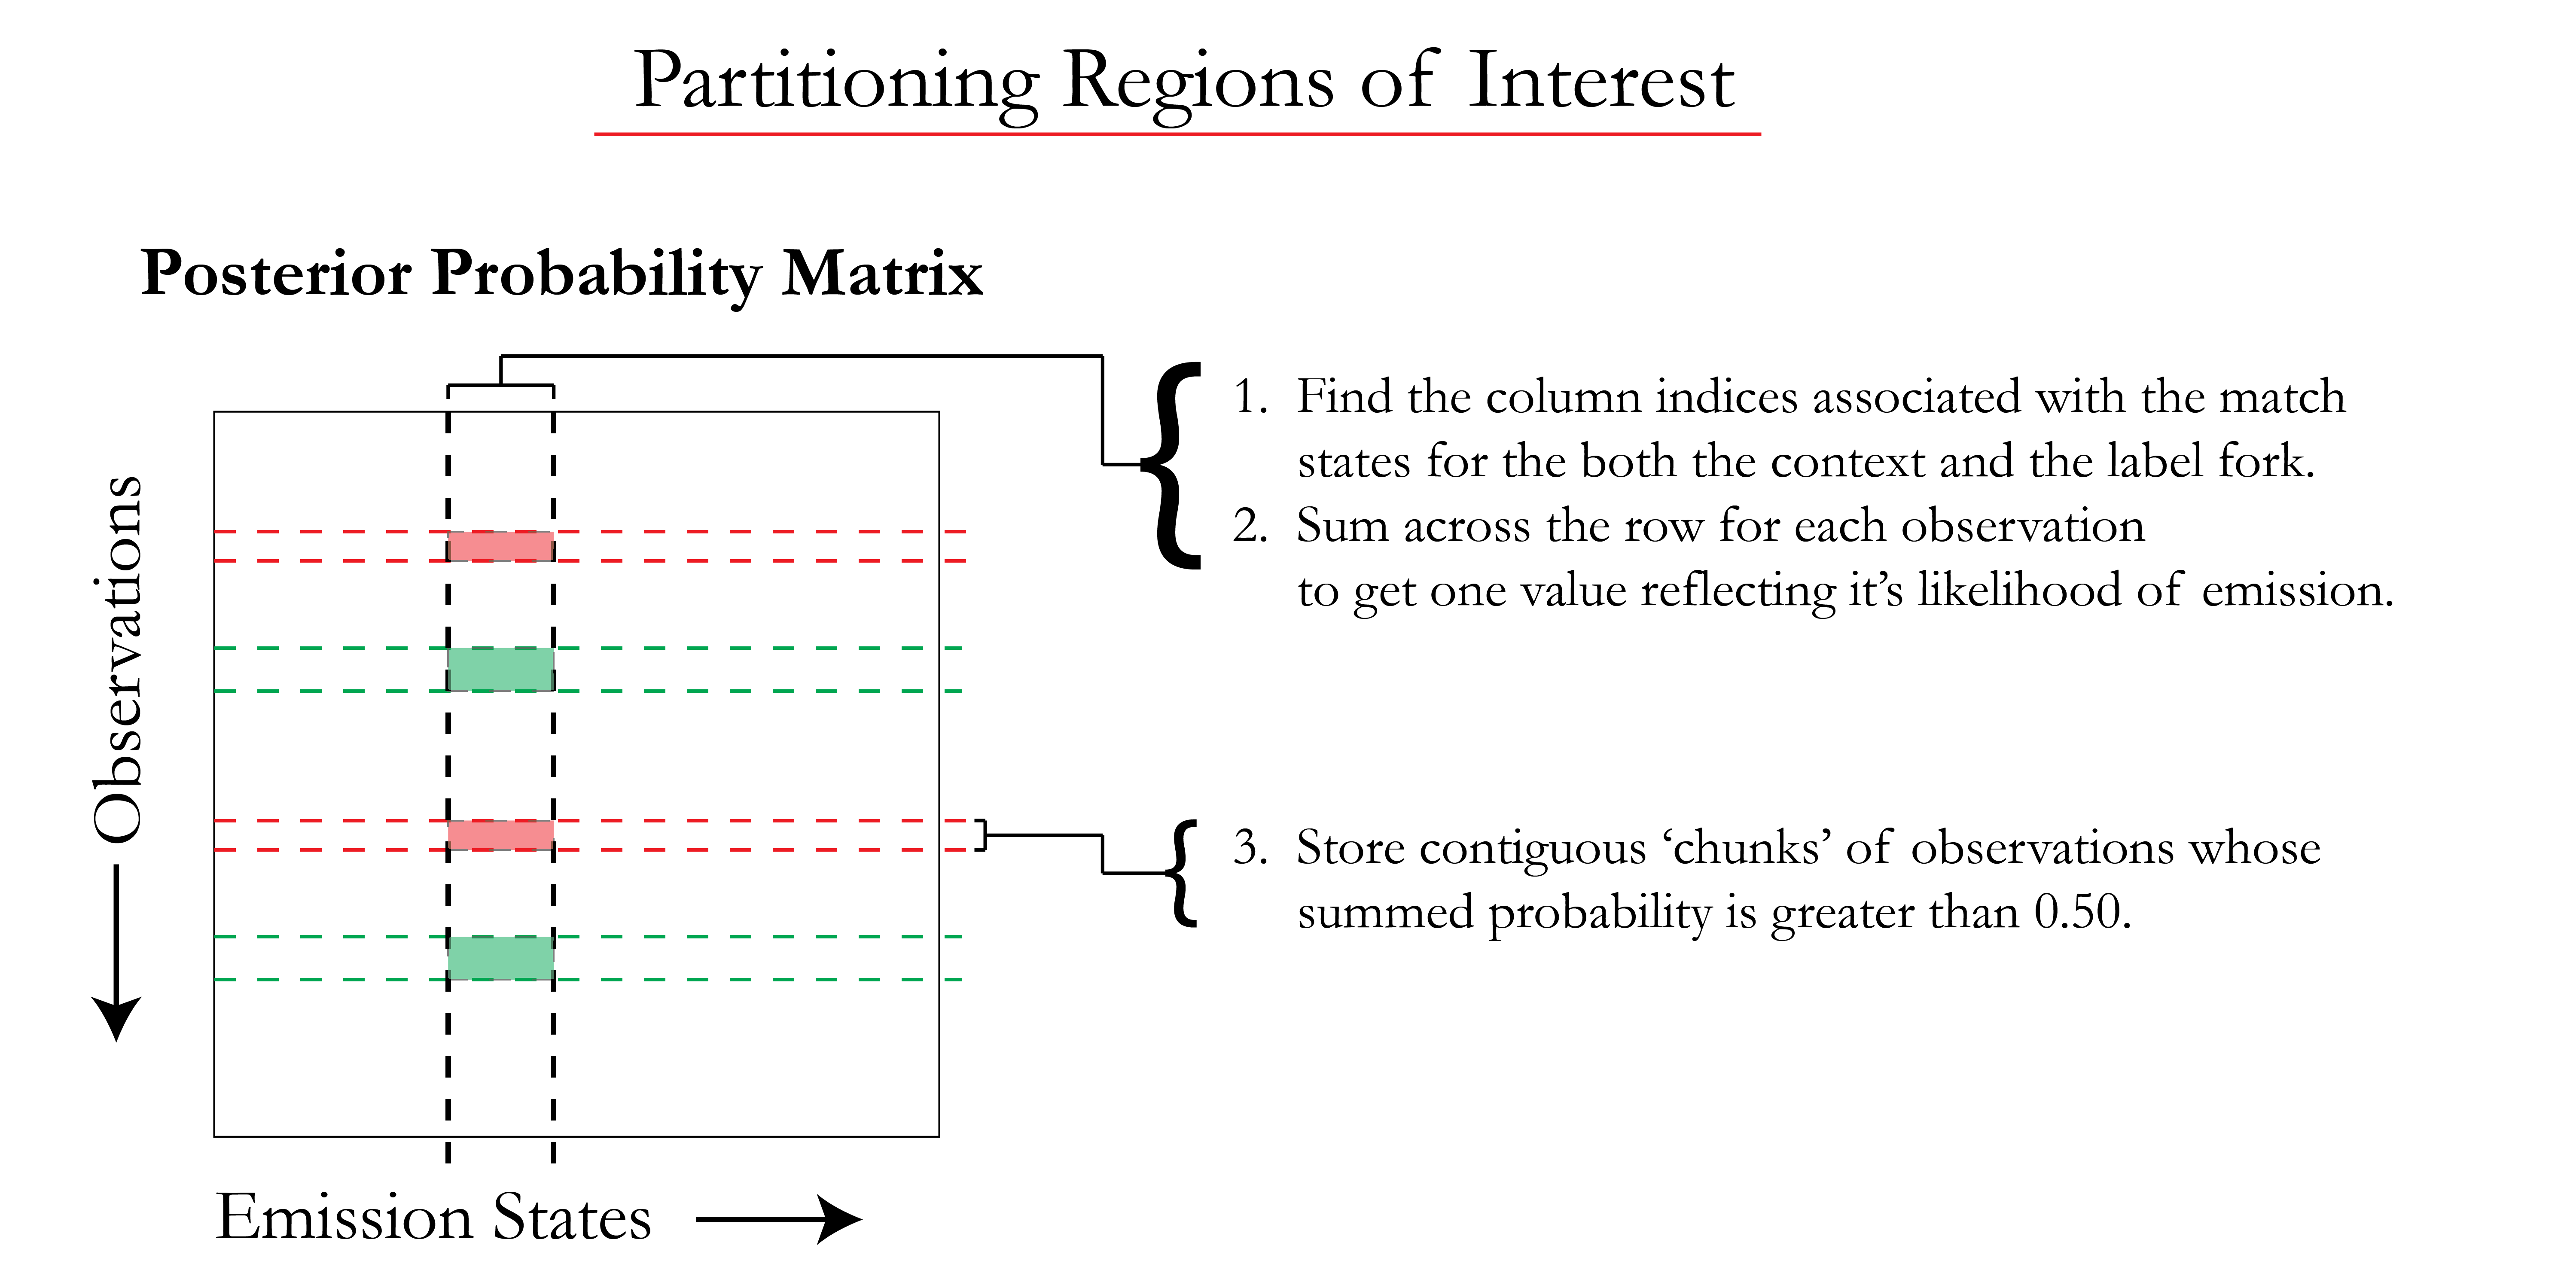 The posterior probability matrix, or emissions (ems) matrix, contains a set of all observed segment means and their probability of emission for every state in the model (i.e. each row sums to 1 across the entire matrix). The match states associated with the context or label fork are selected from the matrix, then summed by row for each observation. Contiguous blocks (chunks) of observations are stored if their respective emission by the match states is greater than 0.50.
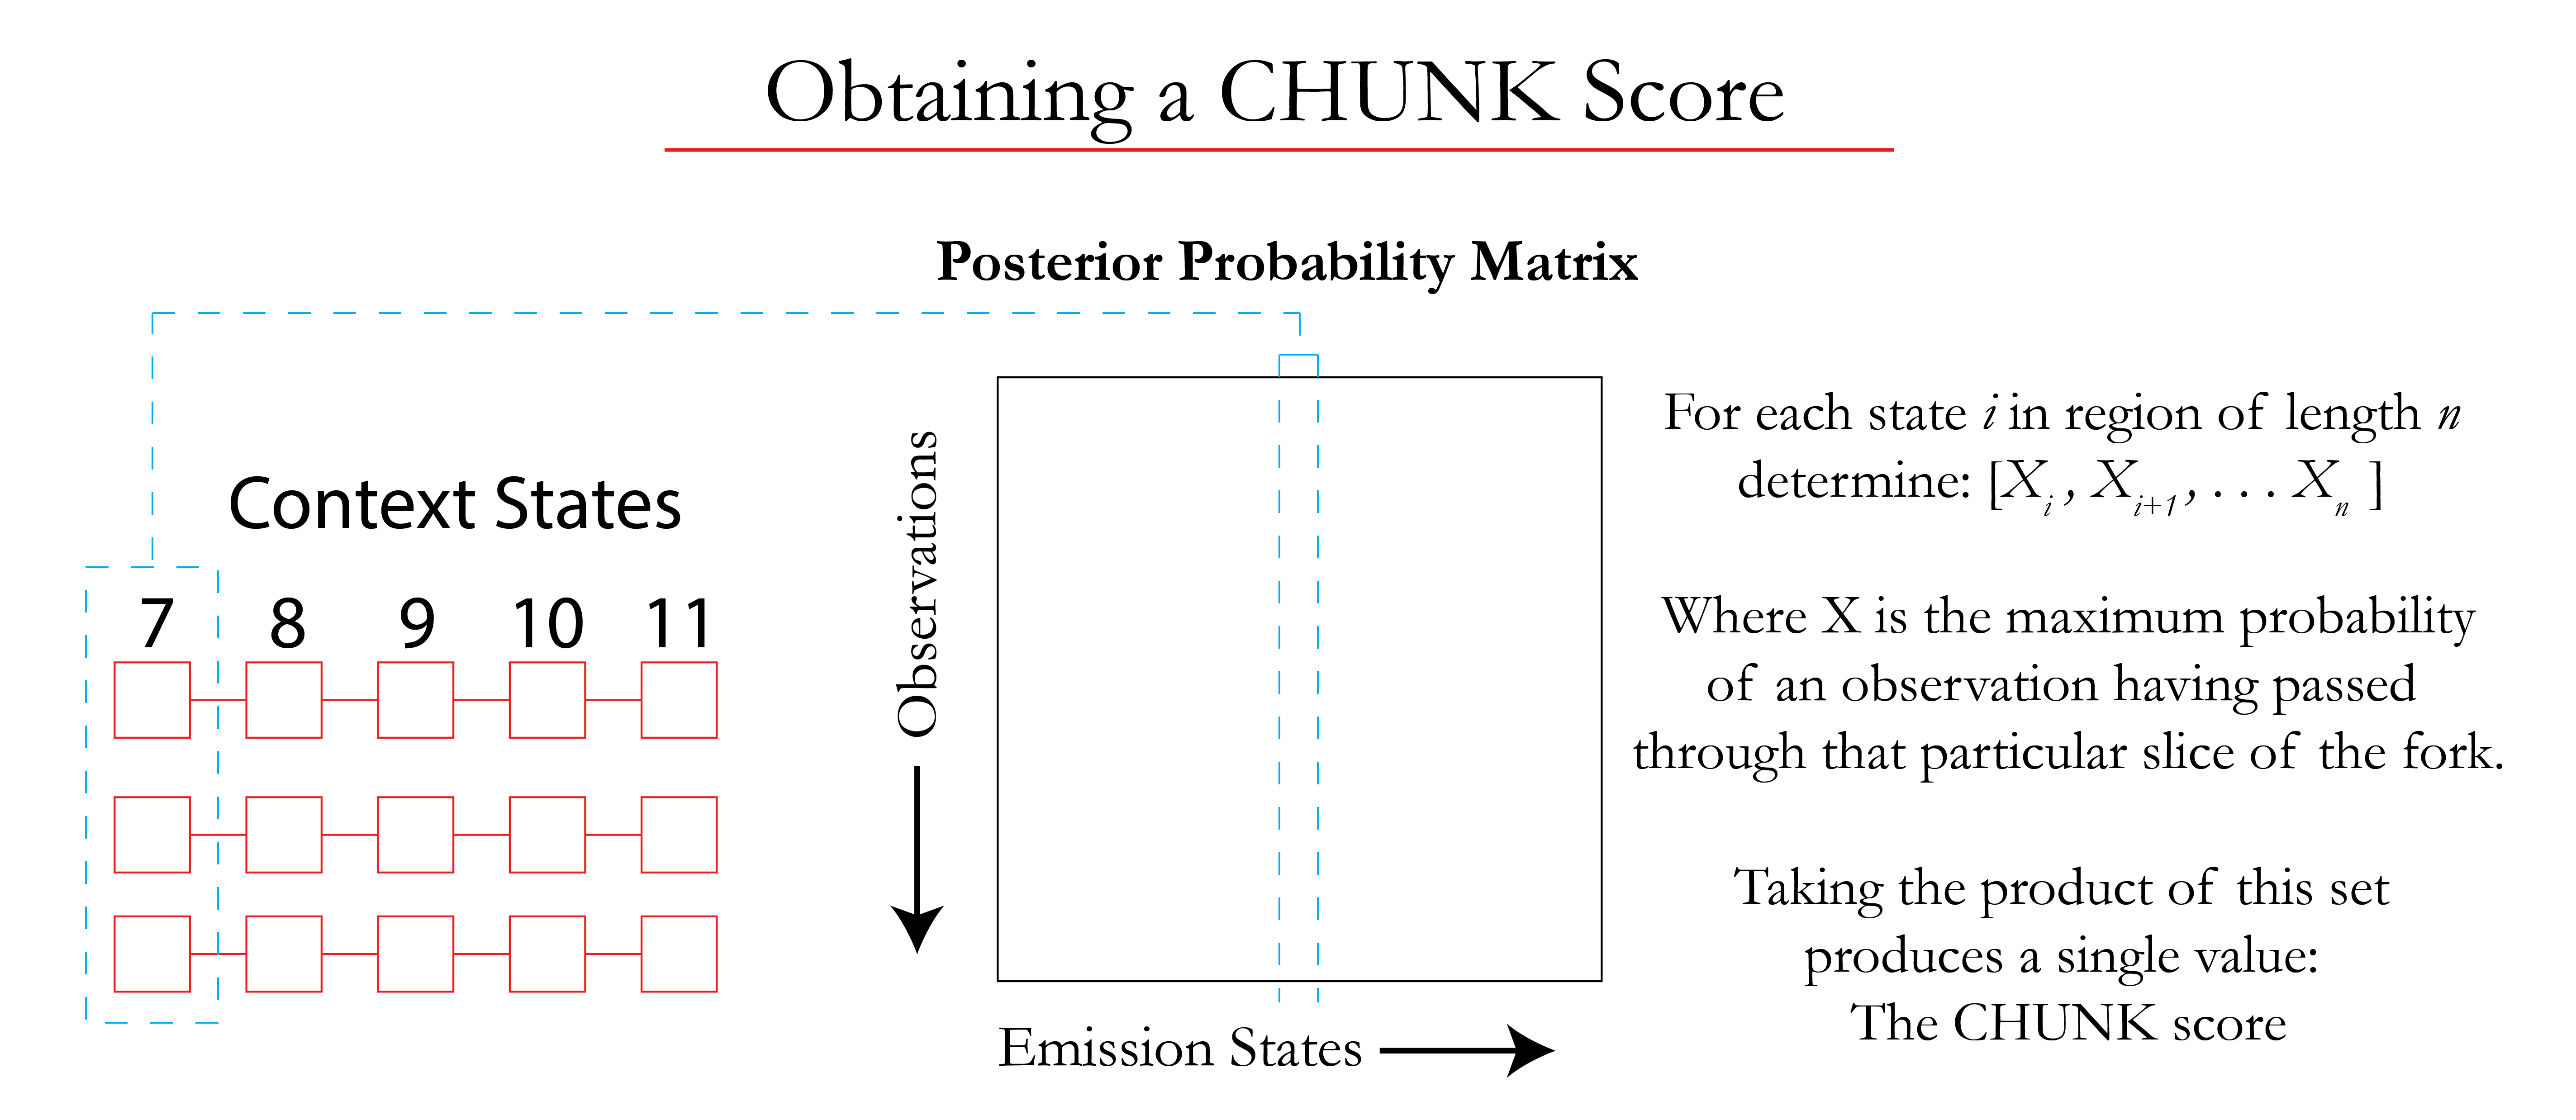 Each 'slice' of the fork is used to guarantee that the chunk is representative of the complete context region. Taking the maximum probability of each slice appearing in the chunk produces a vector of 5 values that are then combined into one value known as the 'chunk score'. These scores are used to rate the level of confidence associated with the chunk.