For many of us, Messenger is the main communicator. It contains a lot of information about ourselves and our relationships. This repository contains a script that generates a bunch of charts about your messages history.
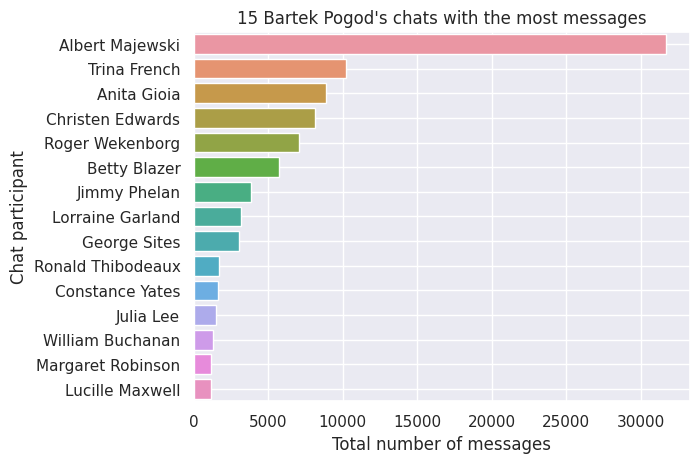
- messages count rank
- overall activity over time
- average activity over a day
- average activity over a week
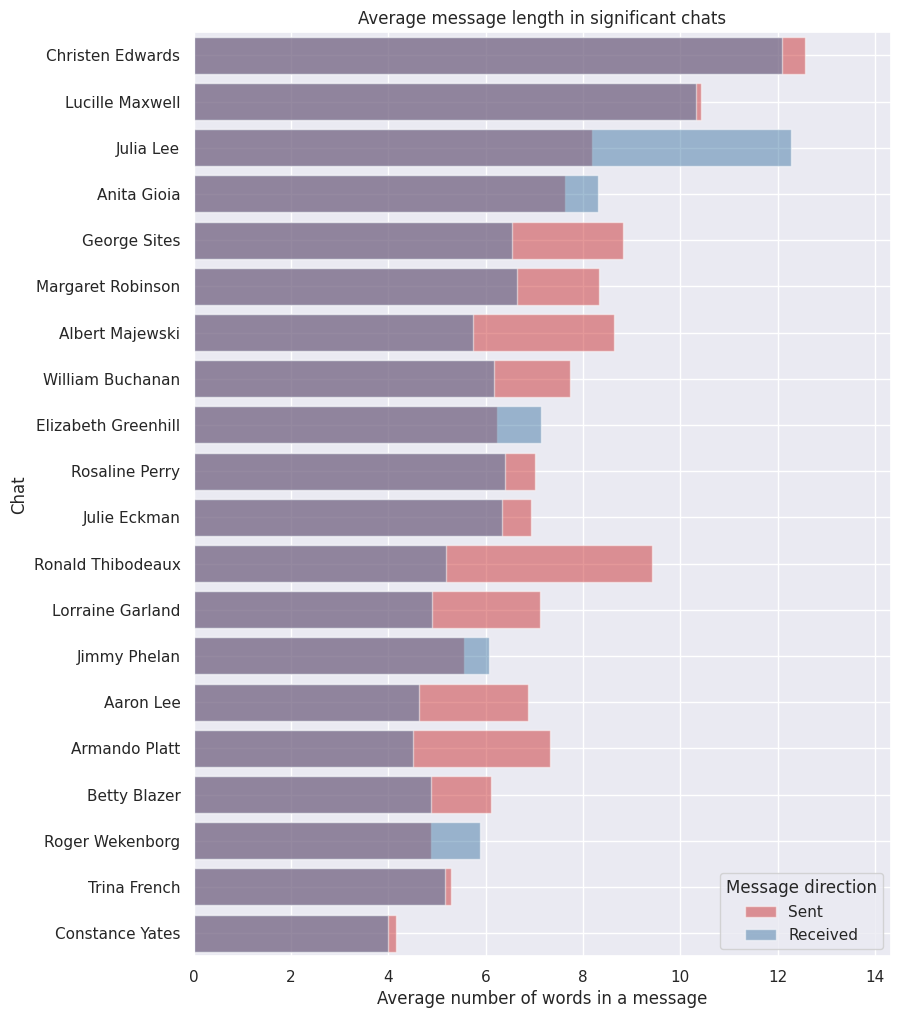
- average message lengths in significant chats
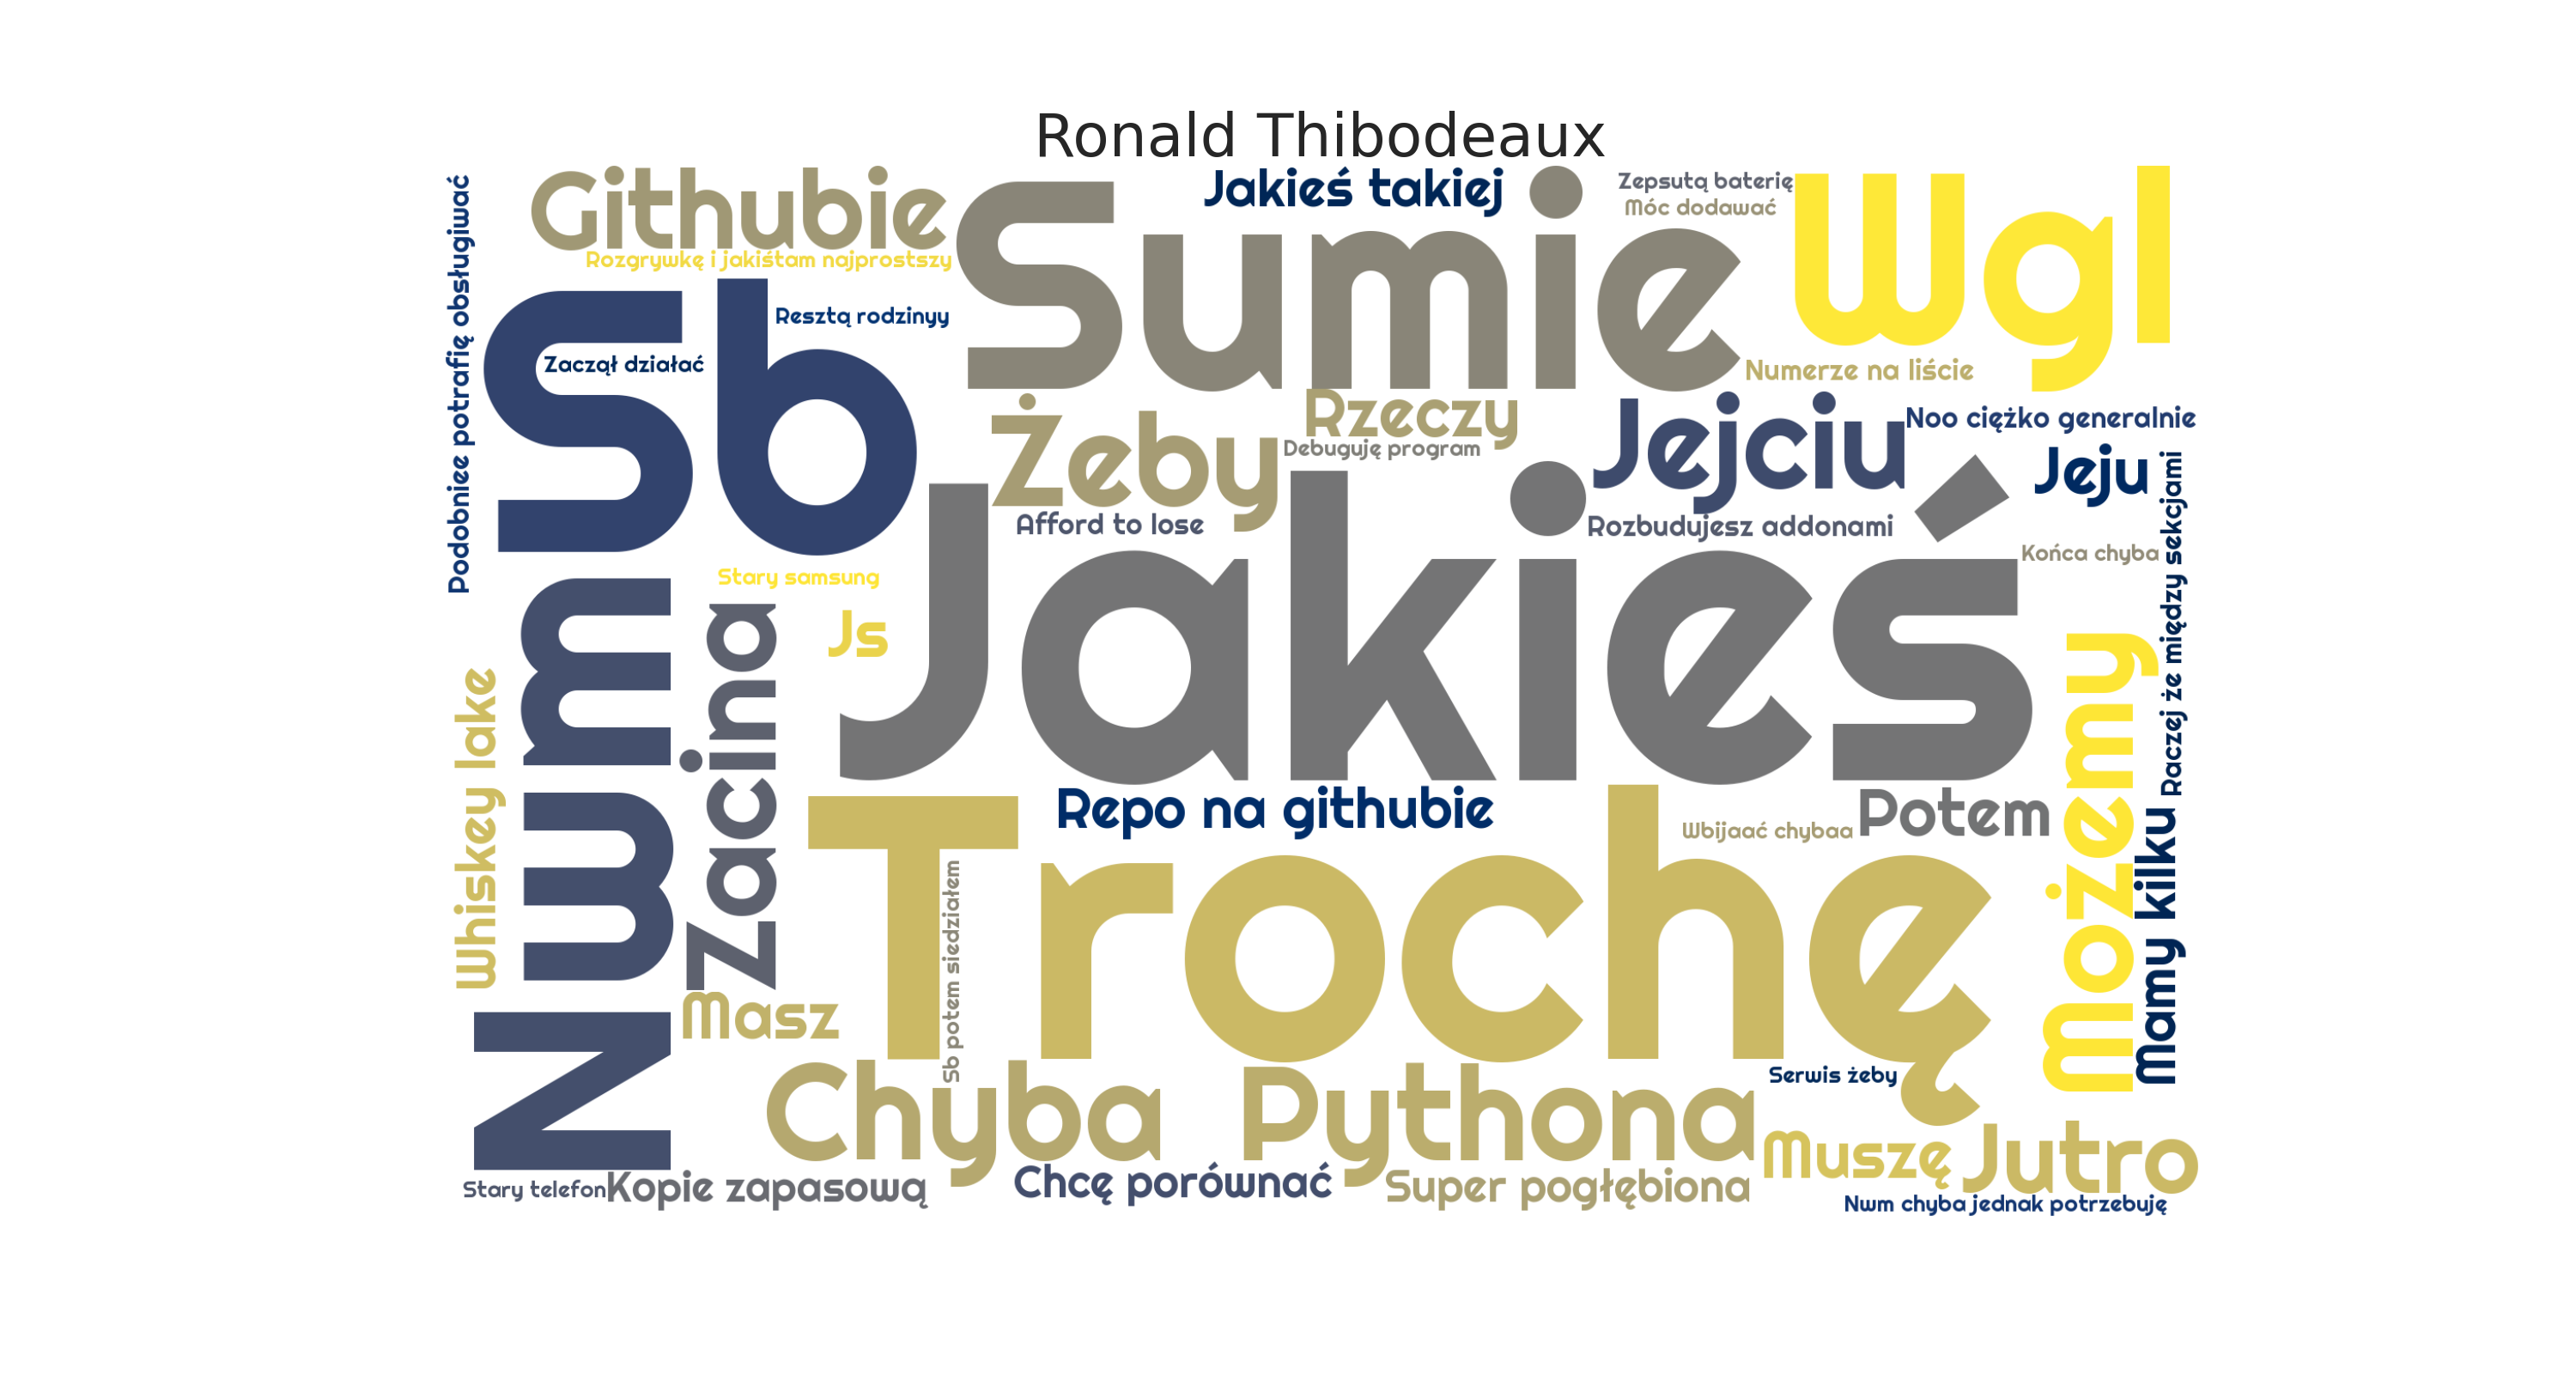
- word clouds of important phrases in chats
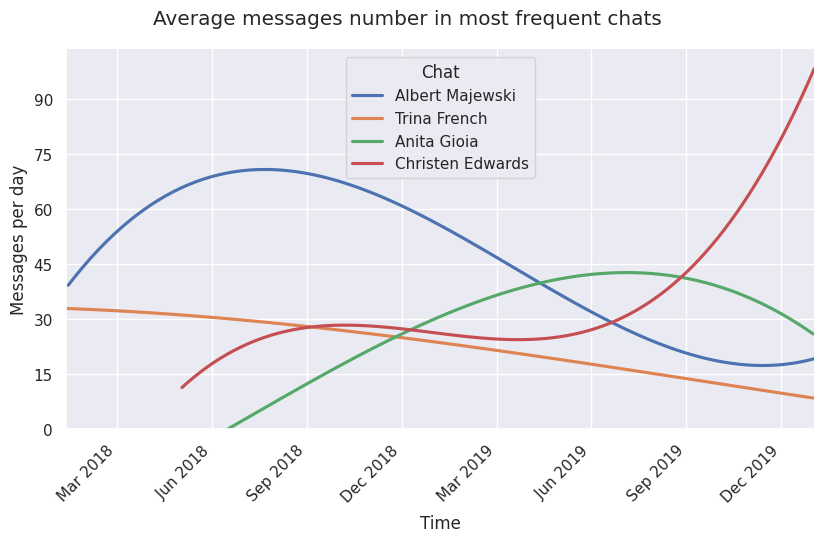
- activity over time per chat
- messages length distributions in significant chats
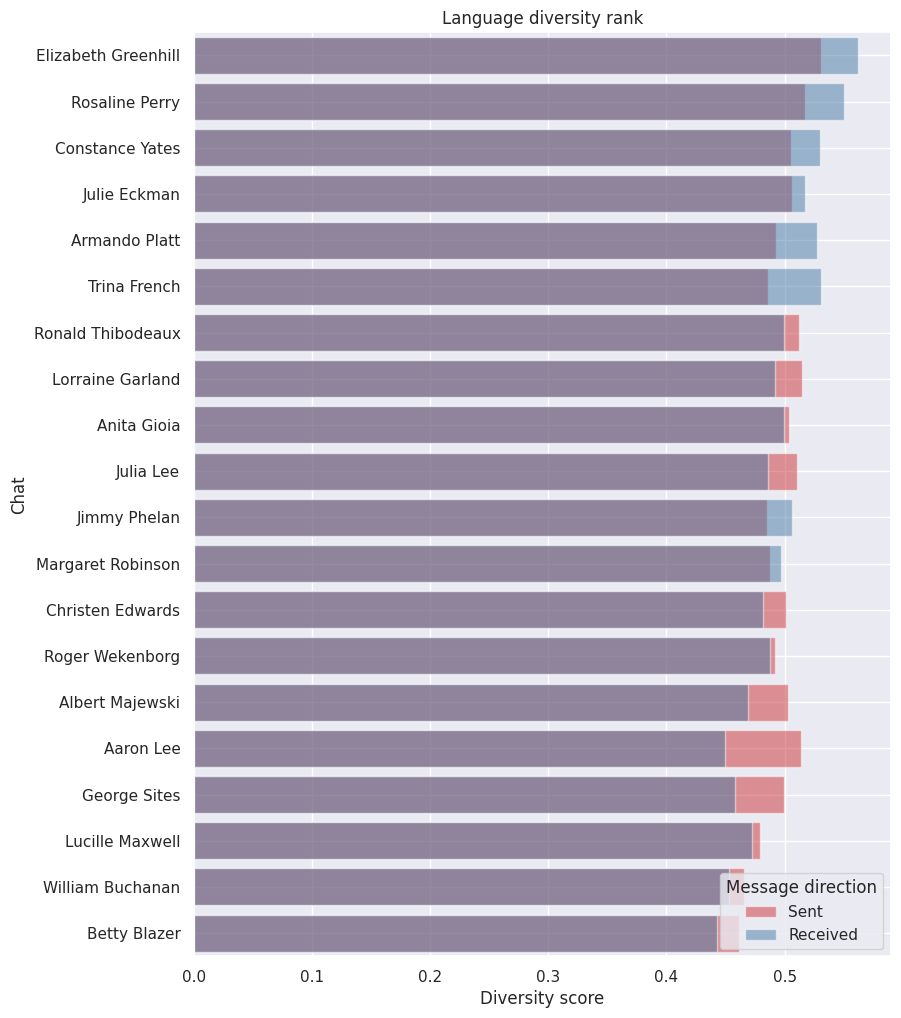
- language diversity rank (experimental)
Facebook enables its users to get their Messenger messages history.
Data requesting steps:
- Go to facebook settings and then proceed to downloading your data.
- Deselect all data and select only Messages
- Choose data format to JSON
- Choose the multimedia quality to low (all the media in chats are downloaded as well but they are omitted by the script)
- Accept data request
Preparing data file shall not take more than 24h. You will be notified when your file is ready.
After cloning this repository place the downloaded zip in zips subdirectory and setup the virtual environment for python 3.8.
On Linux you can use virtualenv.
On Windows you have to use conda virtual environment. You can use either
- Miniconda - install and run cmd via
Anaconda Prompt (miniconda3)andcdto the cloned repository directory - Anaconda - install and run
Anaconda Navigator (anaconda3), then go to Environments, setup new environment, start it via cmd andcdto the repository directory.
After setting up the environment and opening the repository directory run:
pip install -r requirements.txt
python -m spacy download pl_core_news_md
python -m spacy download en_core_web_sm
In params.json you shall set your "user", "language" and "timezone".
{
  "user": "Bartek Pogod",
  "language": "polish",
  "timezone": "Europe/Warsaw",

  [...]
}If all is set up properly the charts shall be generated after running:
python messages_analysis.pyAfter a couple of minutes, all the plots shall appear in figures folder (or other specified in params.json).
This plot can show how your relationships changed over time. It can show when your relationships started to form or to collapse. The lines are smoothened to increase visibility.
This chart can say a lot about the interactions. Usually, longer messages are more formal, possibly more personal. It says "in significant chats", because some chats have too few messages to be considered important.
It is generated using TextRank algorithm. Size of the words shall represent the importance of them in a chat. The example chart is in polish, because it is the first language of the author.
Language diversity score shall represent how diverse is the vocabulary of the speaker in a chat.
To calculate the score the messages sent by a chat participant are prepared - numbers, punctuation and entities are removed. All the words are lemmatized, to get the word base form. Then the messages sent by one person are divided into batches of 2000 words. For every 2000 words, there is calculated the quotient of lemmas number and batch size (2000). The final score is a mean of those quotients.
The possibilities are almost endless. Take a look at the issues tab to write your own ideas or see how you can help! Let's make something great :D.
