An analysis pipeline for joint analysis of neural spiking data and synaptic connectivity. This repository encompasses all analyses performed in the following manuscript:
Topology of synaptic connectivity constrains neuronal stimulus representation, predicting two complementary coding strategies
https://www.biorxiv.org/content/10.1101/2020.11.02.363929v1
- cmake >= 3.4
- python >= 3.7
- h5py
- numpy
- simplejson
- scipy >= 1.0.0
- scikit-learn
- pandas
- progressbar
- pyflagser
- future
- networkx
Download the repository and submodules with:
- git clone --recursive https://github.com/BlueBrain/topological_sampling.git
Then, install the python dependencies for reading / writing results and configurations:
- cd common/toposample_utilities
- pip install .
Next, install the python dependencies for counting directed simplex containment:
- cd common/pyflagsercontain
- pip install .
Next, obtain the input data used for our paper (or use your own simulation results!) under the following DOI: 10.5281/zenodo.4317336 and place it into working_dir/data/input_data. More detailed information on where exactly each result file goes is given in the description of the dataset at the specified DOI.
The following four input files are required:
- The adjacency matrix of the circuit in scipy sparse csr format, exported to .npz
- The spike trains of the simulation. In a numpy.array with two columns, where the first column denotes the time in ms of a spike and the second a global identifying integer (GID) of the spiking neuron. Exported to .npy using numpy.save
- The classification labels for the the stimuli as a numpy array. Each entry is interpreted as an identifyer of a stimulus associated with a time window. Duration of the time window configured in the associated config file. Time windows are assumed to have the same duration and directly follow each other, with no break in between. Exported to .npy using numpy.save
- A pandas database containing the layers, morphological type and (x,y,z) coordinates of the neurons. Index by the GID (see above) of the neuron. Exported to pickle using pandas.to_pickle.
In the source code and the following explanations, we sometimes refer to "tribes" (e.g. "structural_tribe_analysis", "sample_tribes")."Tribe" is the term we used for samples of a neuron and its entire graph-theoretical neighborhood in an early version of the associated manuscript. We have since been alerted that this is unfortunate and non-inclusive terminology and have updated the manuscript to use the term "neighborhood" instead. Yet, we have decided not to reflect this change in the source code at this point, as the likelihood to break something is too high. For consistency, we also keep the old terminology in this documentation.
We apologize for any confusion or offense given.
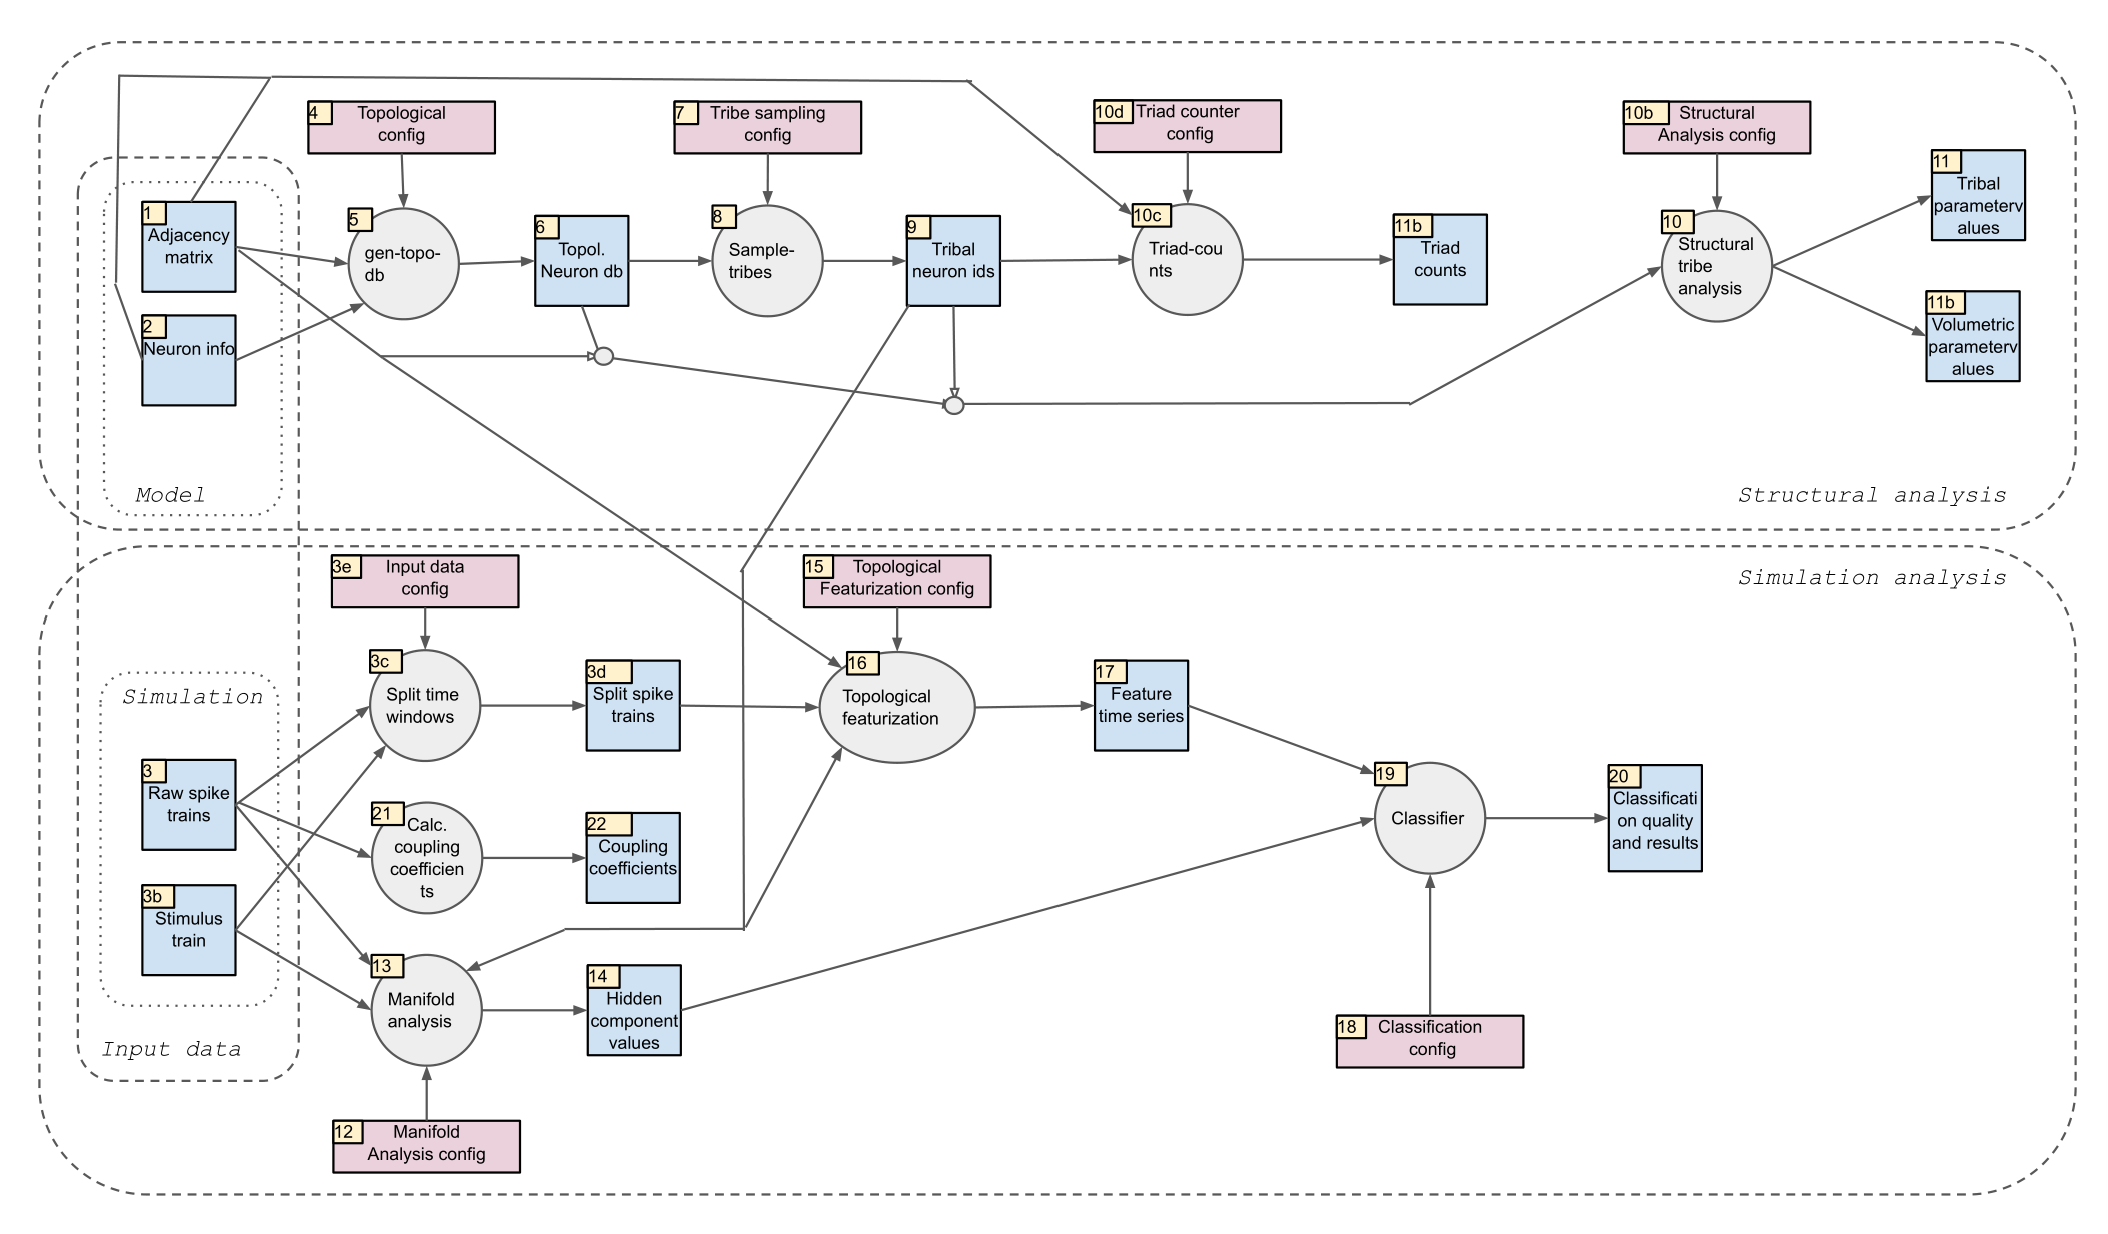
 Blue squares denote input / output files (obtainable under the following DOI: 10.5281/zenodo.4317336). Grey circles denote steps of the analysis pipeline (that are implemented in this repository). Red rectangles denote configuration files (that are also in this github repository).
Then run the pipeline steps in order:
- pipeline/gen_topo_db
- pipeline/sample_tribes
- pipeline/struc_tribe_analysis
- pipeline/count_triads
- pipeline/split_time_windows
- pipeline/manifold_analysis
- pipeline/topological_featurization
- pipeline/classifier
Each step of the pipelin provides its own README that describes how to run it. It also lists potential additional dependencies in addition to the ones listed in common/setup.py
Configuration of each step and the pipeline as a whole is given in working_dir/config. If you want to change some of the parameters either edit them directly, or create a copy of the working_dir and change the configuration in that copy and work there.
After running the pipeline the analyzed output data is found under working_dir/data/analyzed_data.
jupyter notebooks that use the analyzed data to create the figures (or individual panels) of the paper can be found under notebooks:
- cd notebooks
- jupyter notebook
They create the figures and also provide a good starting point for learning how to work with the input and/or analyzed data.
If you decide to use any part of this software, please reference the following manuscript:
Michael W Reimann, Henri Riihimäki, Jason P Smith, Jānis Lazovskis, Christoph Pokorny, Ran Levi: "Topology of synaptic connectivity constrains neuronal stimulus representation, predicting two complementary coding strategies"
https://www.biorxiv.org/content/10.1101/2020.11.02.363929v1
doi: https://doi.org/10.1101/2020.11.02.363929
The development of this software was supported by funding to the Blue Brain Project, a research center of the École polytechnique fédérale de Lausanne (EPFL), from the Swiss government's ETH Board of the Swiss Federal Institutes of Technology.
Copyright © 2020-2022 Blue Brain Project/EPFL