A Javascript module and accompanying QGIS plugin for displaying an air gap visualization generated from a point cloud.
See the README in doc for full documentation.
The module provides two classes. AirGapVisualization uses air gap data from tidesandcurrents.noaa.gov and requires a station ID that provides air gap data. WaterGageVisualization uses gage data from water.weather.gov and requires one or two gage IDs. If two gages are provided, the air gap is calculated using an interpolated value based on distance from the area being visualized.
-
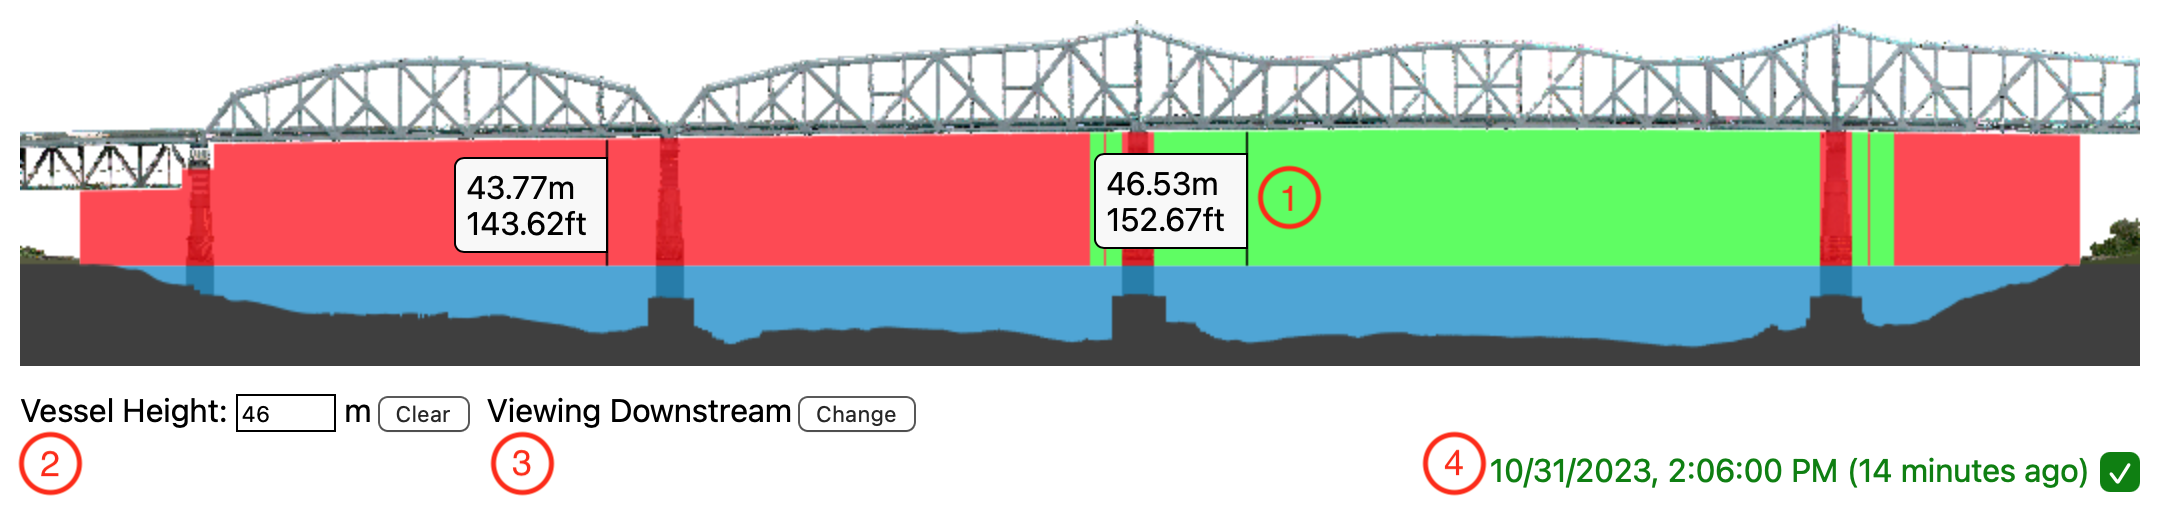
Air Gap Area - Mousing over this area will show the current air gap at that point. When a vessel height is entered, the background turns green for areas with enough clearance and red for obstructions and areas without enough clearance. When initializing the visualization, default marker locations may be added. These are defined as pixels from the left edge of the initial image that will be used.
-
Vessel Height - The height in meters to use when determining clearance. The visualization is updated as the number is input.
-
Orientation Display - Swaps between the upstream and downstream views of the location. Upstream and downstream is determined using a combination of the
initialOrientationandupstreamDirectionoptions. -
Data Update - The timestamp of the air gap or gage data being used. Whether data is considered recent (green) or out of date (red) is controlled with the
staleDataoption.
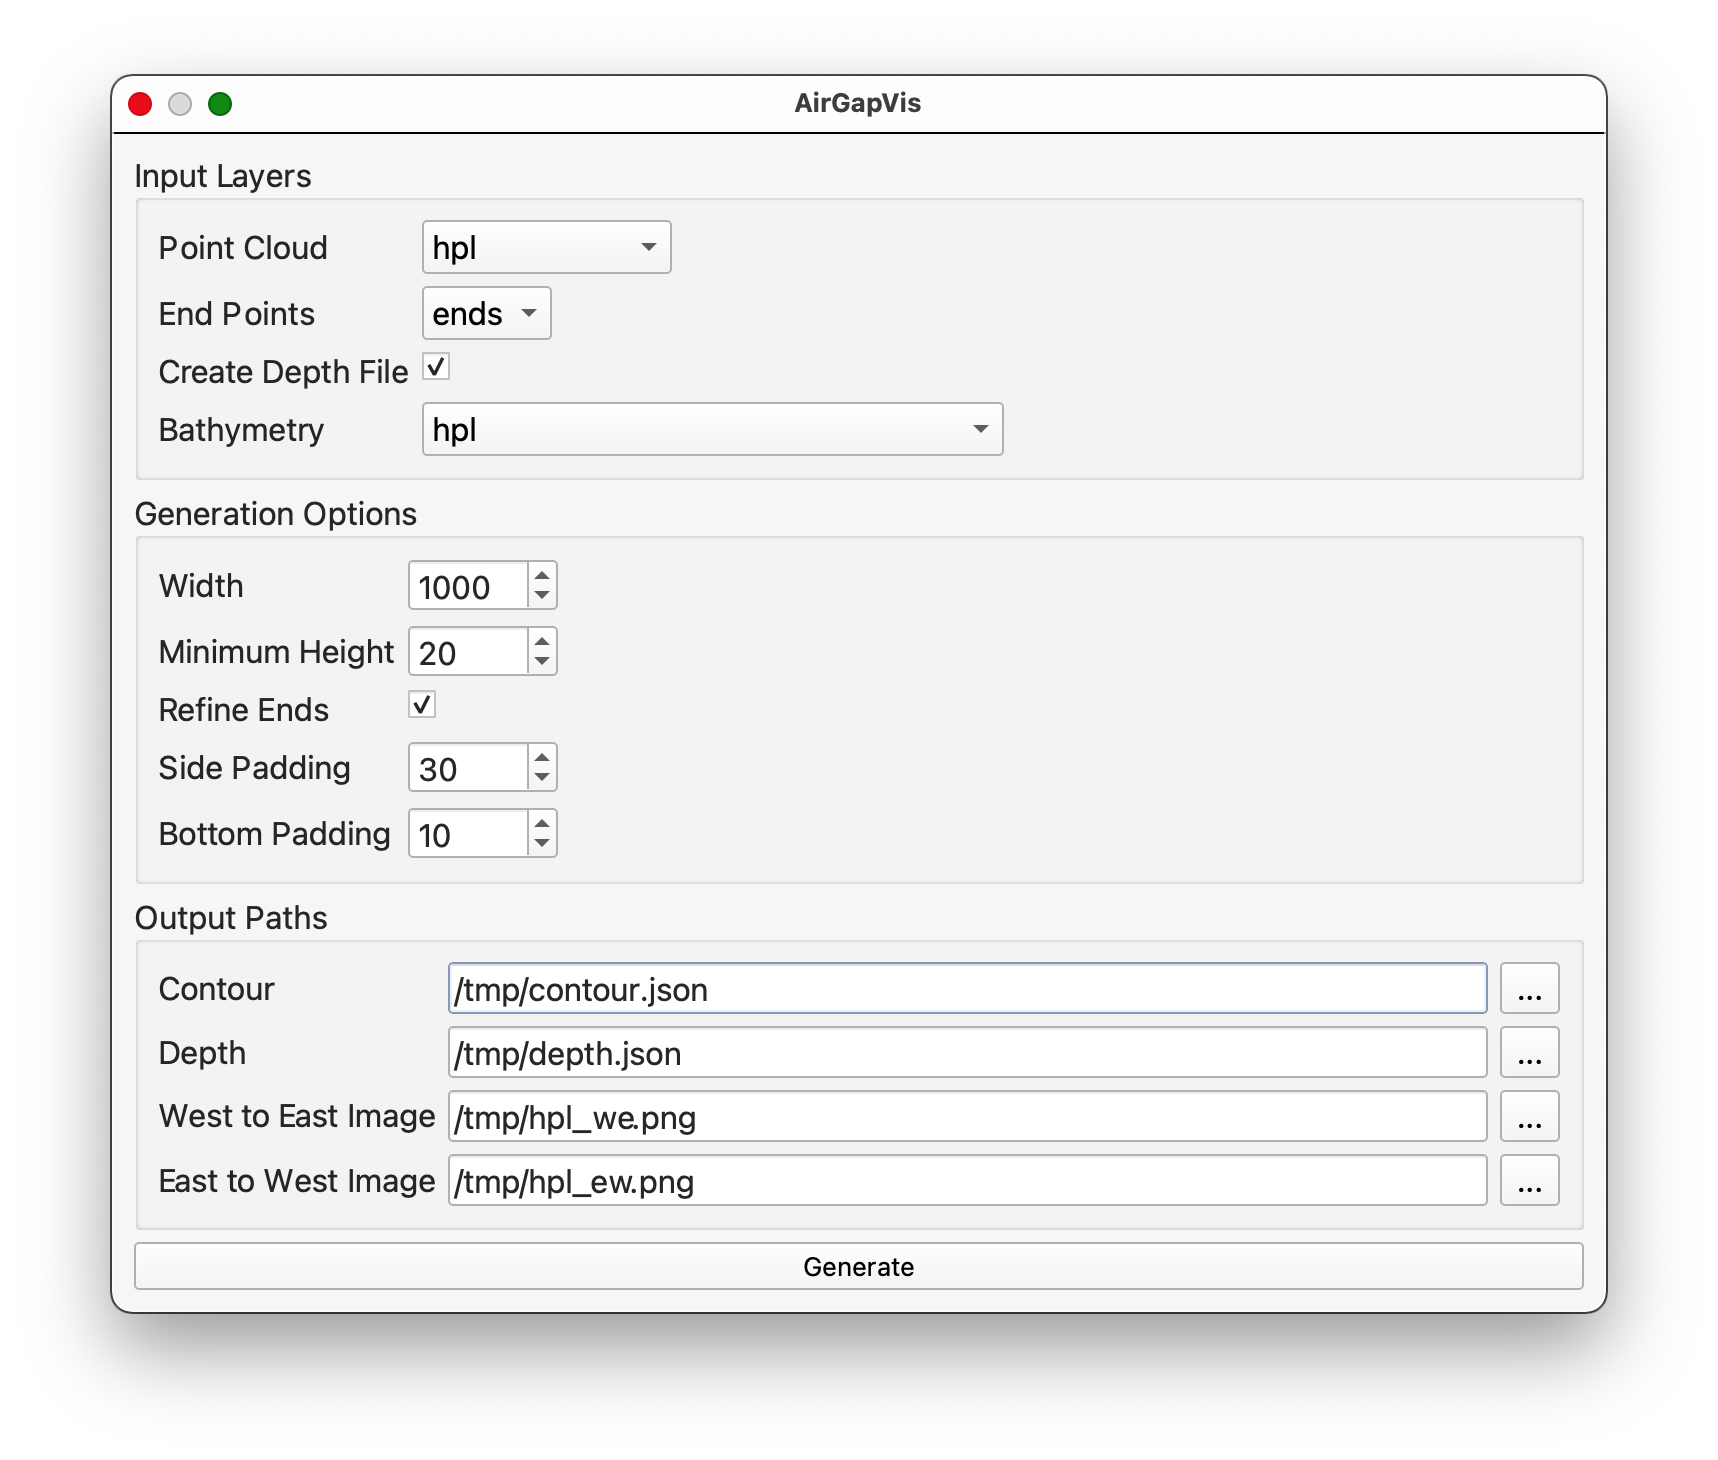
- Select the point cloud, end point layer and bathymetry layer. The applicable layers for each type will be ordered as they appear in the Layers panel.
- Modify the Generation Options as needed.
- Set the Output Paths.
- Click Generate to create the files.
Once the files have been generated, a simplified version of the air gap visualization will be displayed in order to check the generated files. The initial window will still be open, and a Show Simulated Visualizations button is added above the Generate button.
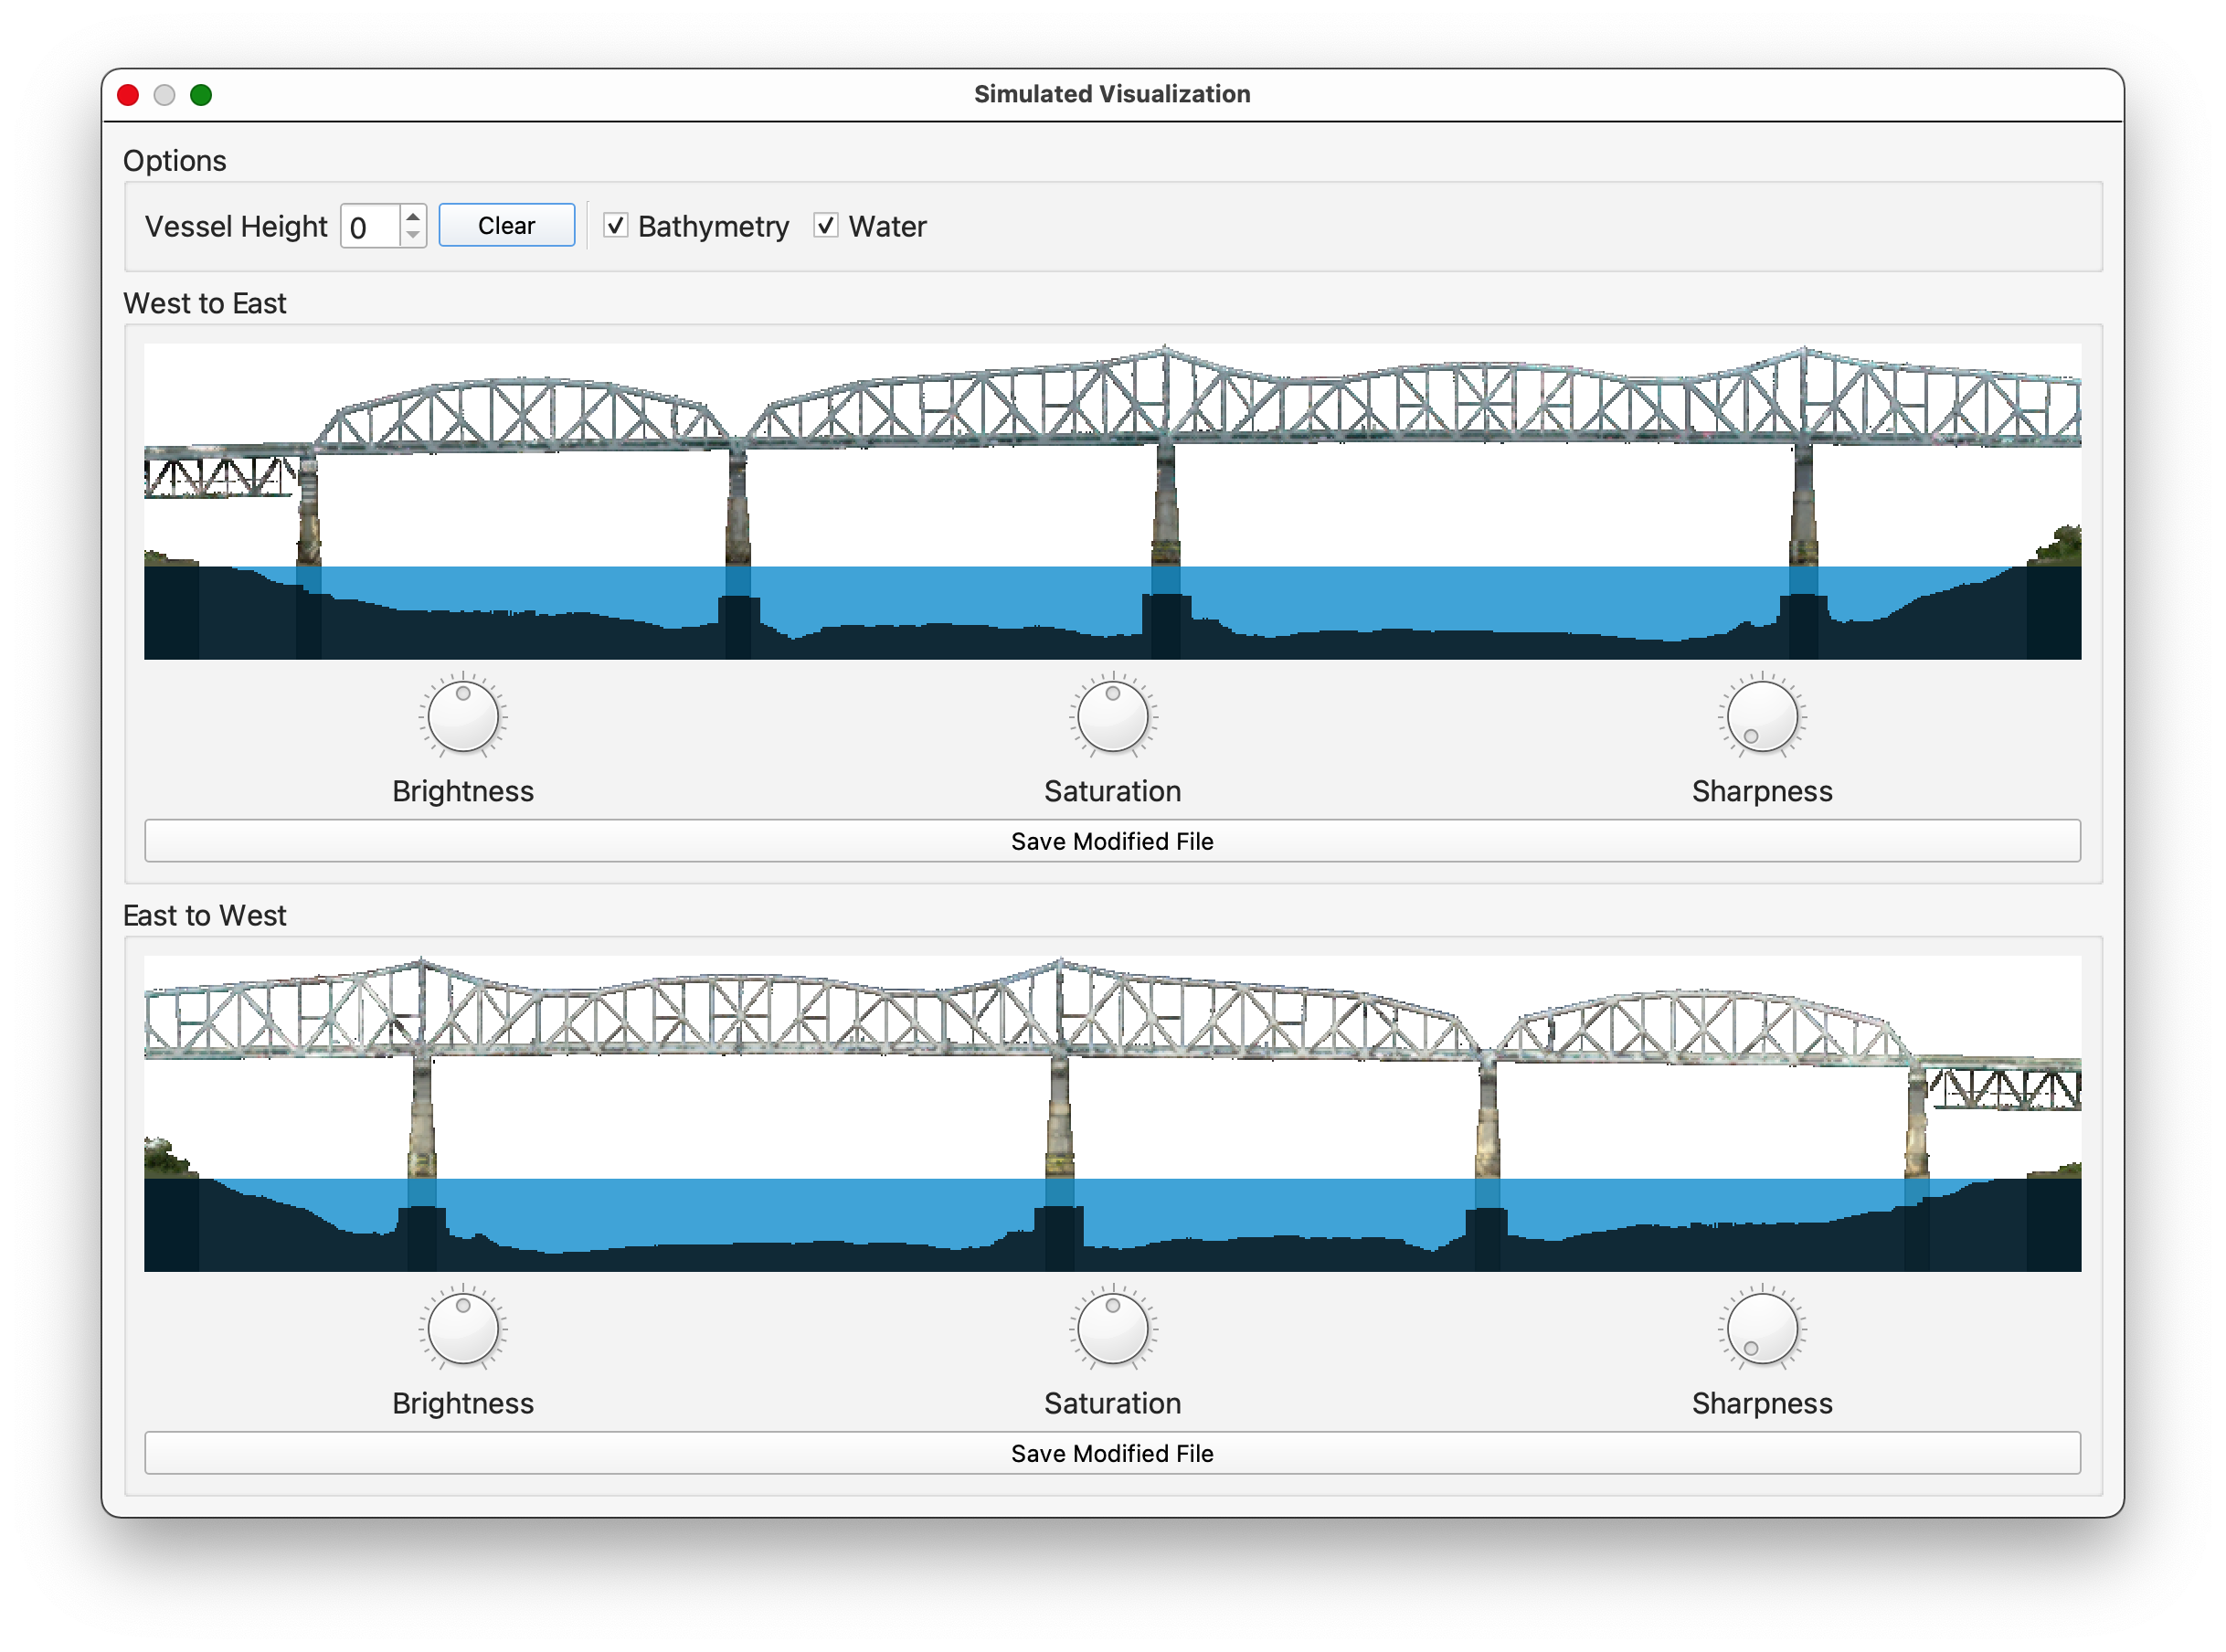
Both the West to East and East to West views are shown. Vessel Height may be entered at the top of the window to inspect the contour and check if any stray extra points may have caused issues with the contour generation. The water level is set to the 0m elevation of the point cloud and may be disabled along with the bathymetry display to inspect the background image.
Three image parameters may be adjusted using the dials underneath each image. Since the image itself is fully transparent in areas that do not have points, these parameters do not affect the background. The save button underneath the dials overwrites the original image.