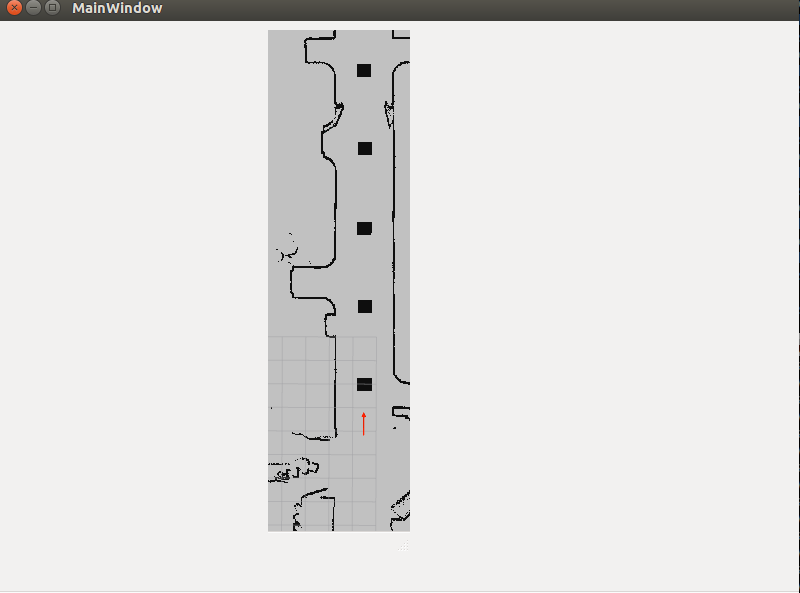
An example for using a rviz config file in your custom PyQt UI.
This is a useful example describing how to use rviz functionalities in your custom PyQt based UI. I have picked up parts of my code from one of my own projects to describe how to use rviz map and odom display in my own PyQt based UI. You can visualise other topics as well as per your need. Although, some topics might not work very well.
Follow my comments in the rviz_custom_example.py and this link http://docs.ros.org/hydro/api/rviz_python_tutorial/html/ for help.
Basically you would first need to create a .ui file in Designer for your UI. I have just created a Simple Window with one GridLayout to hold my rviz widget.
Then go ahead and open rviz and create a .rviz file. In my project, I have used the map display in my custom UI, so first I created the appropriate .rviz file in rviz.
After this, just write a python script, for loading your UI. Just follow my comments on the rviz_custom_example.py for instructions.
After that, go ahead and run your script.
Here, is how this example looks in action.
Note: The map display created above is not a static image, whatever rosmsgs are published on the topics during the run, the rviz widget gets updated accordingly, as it would on a separate rviz window. Therefore, this provides a way for you to visualise rostopics on rviz along with your other Qt Widgets.
P.S: You won't be able to directly run this example on your machine, beacuse some of the specific static resources that have been used are not included here. But I hope this example was helpful.
