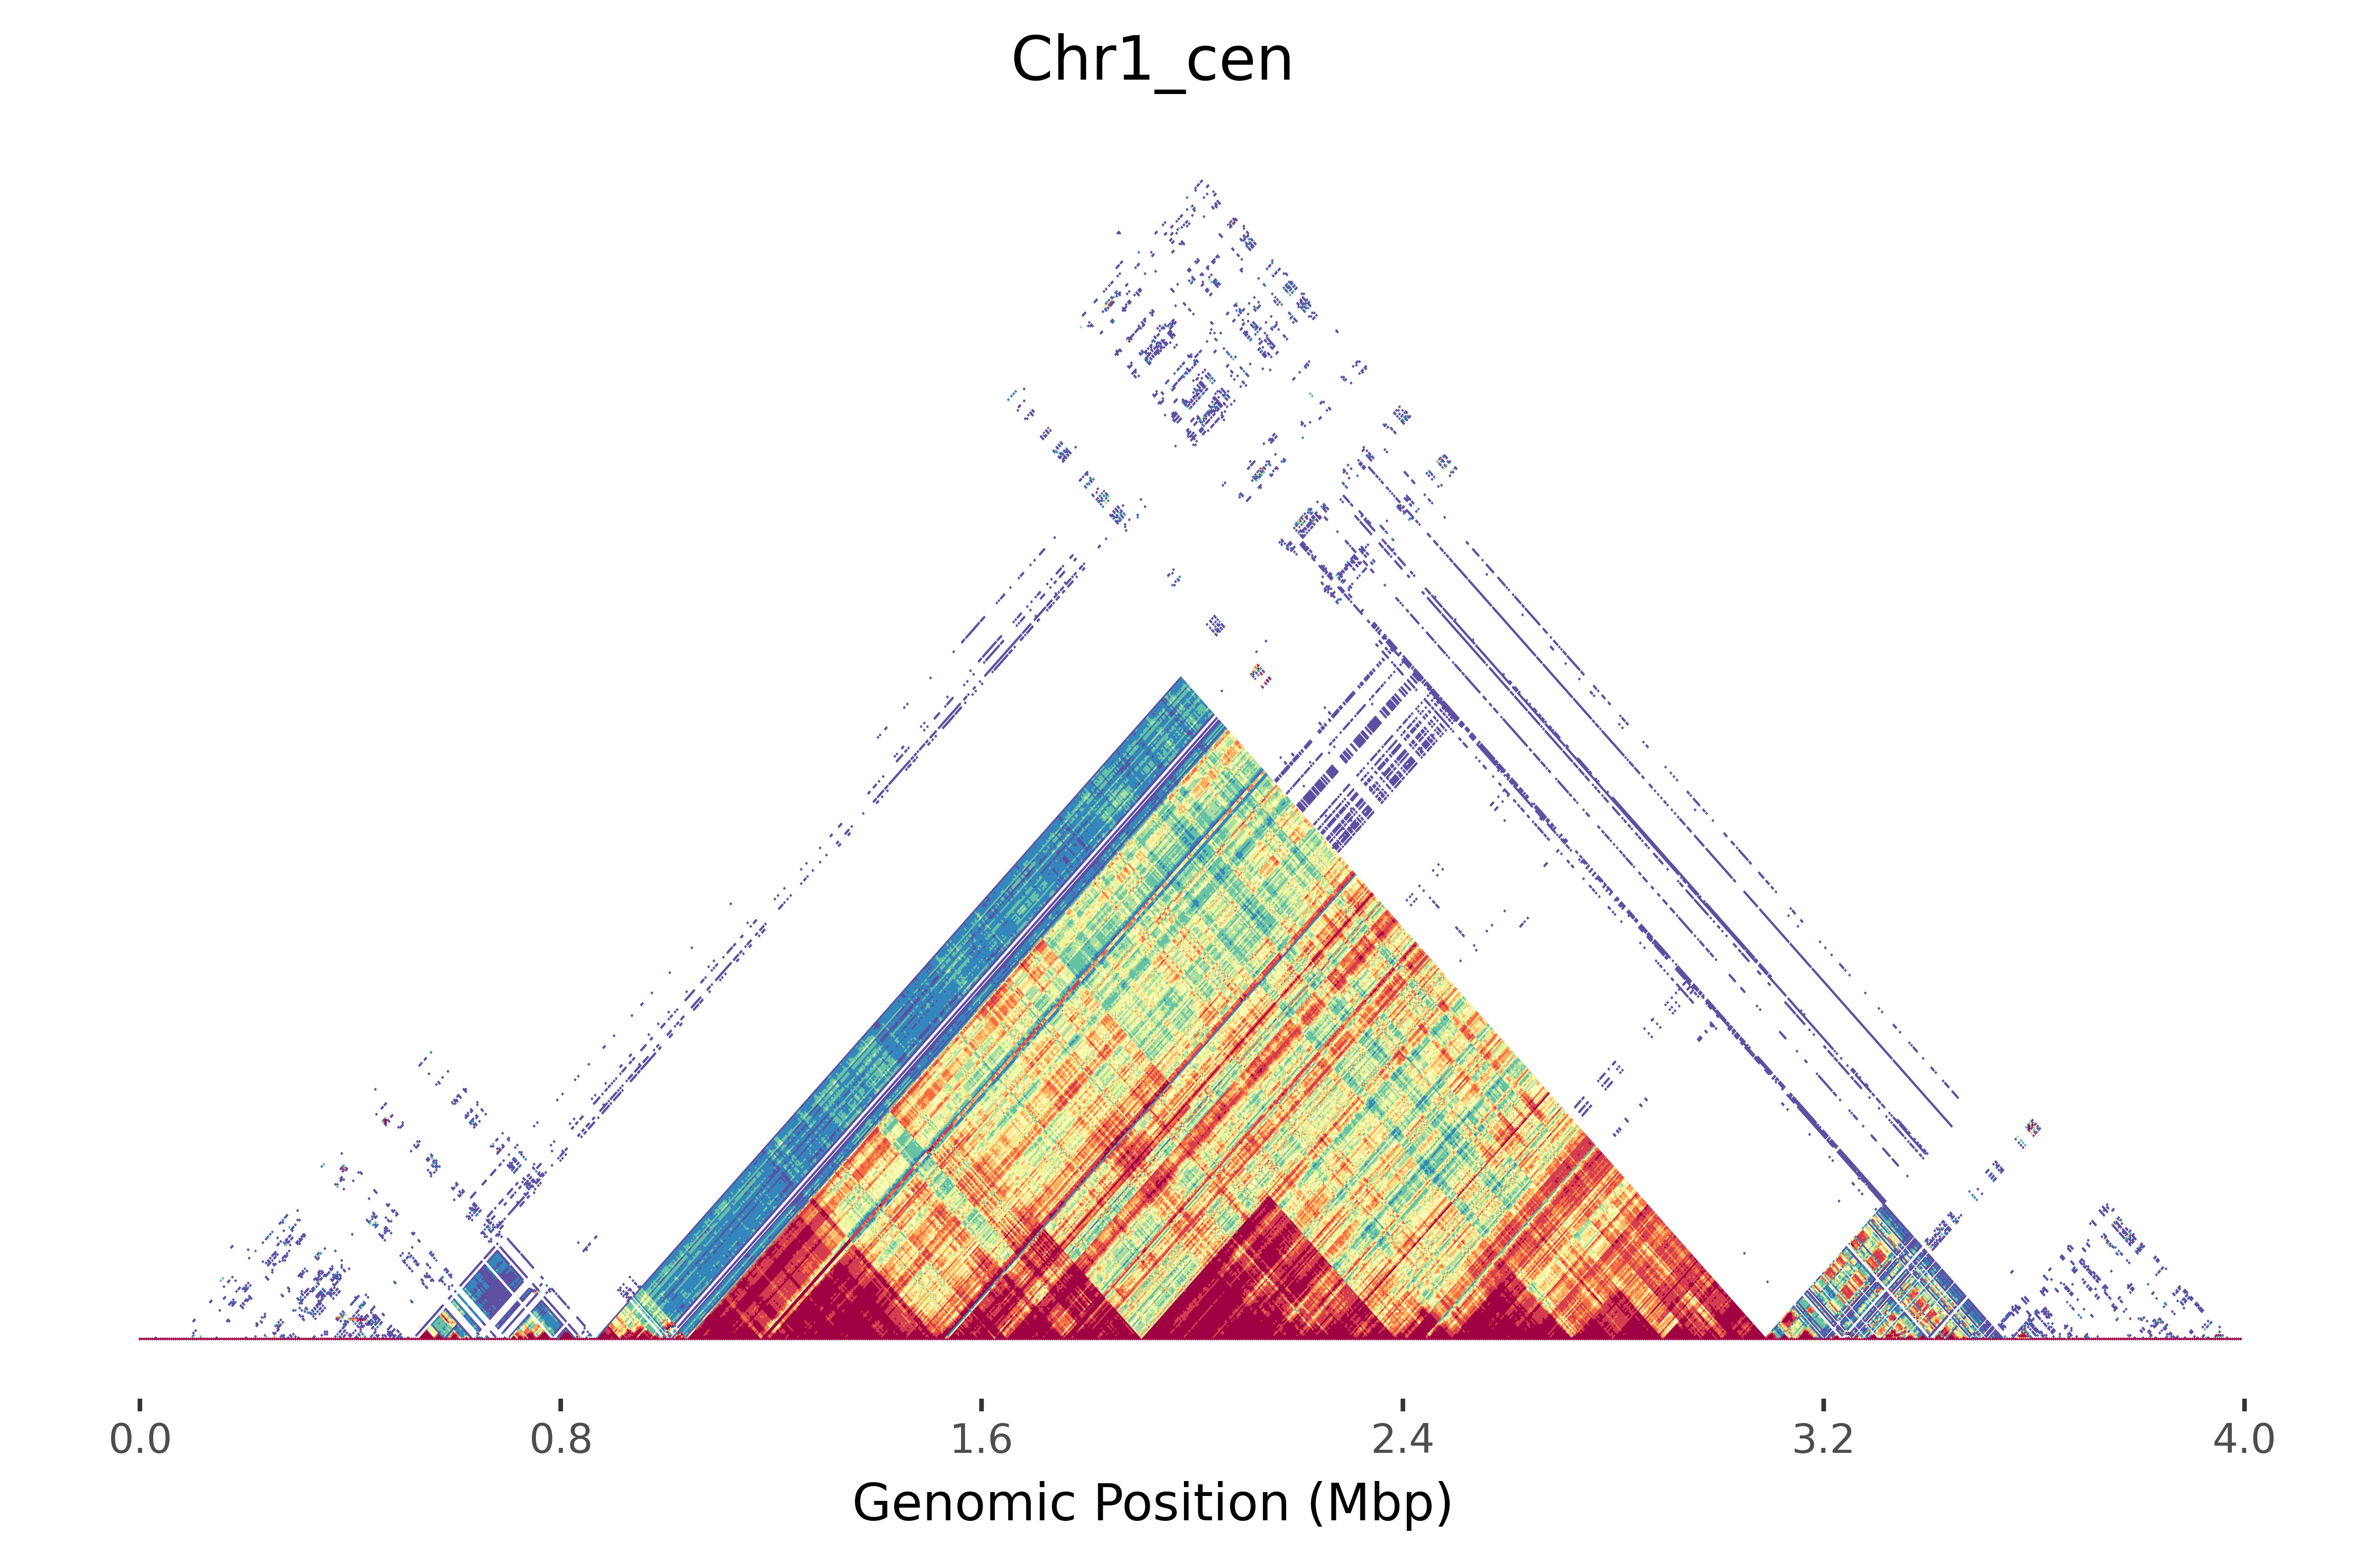
Mod.Plot is a novel dot plot visualization tool used to view tandem repeats, similar to StainedGlass. Mod.Plot utilizes modimizers to compute the Jaccard coefficient in order to estimate sequence identity. This significantly reduces the computational time required to produce these plots, enough to update in real time!
git clone https://github.com/marbl/ModDotPlot.git
cd ModDotPlot
Although optional, it's recommended to setup a virtual environment before using Mod.Plot:
python -m venv venv
source venv/bin/activate
Once activated, you can install the required dependencies:
python setup.py install
ModDotPlot requires at least one sequence in FASTA format:
moddotplot -i INPUT_FASTA_FILE(S)
-k / --kmer <int>
K-mer size to use. This should be large enough to distinguish unique k-mers with enough specificity, but not too large that sensitivity is removed. Must be 32 or less due to integer bit packing constraints. Default: 21.
-s / --sparsity <int>
This is the value used selecting modimizers using 0 mod s, an inverse of the selected k-mer density. A lower value will be more accurate, at the expense of longer plotting time & longer refresh rates in interactive mode. The default is s = 2/Mbp of sequence for fast performance without compromising accuracy. For example, on a human Y chromosome ~ 64Mbp, Mod.Plot will set s = 128. Interactive mode will automatically round up to the nearest even integer.
-o / --output <string>
Name of output bed file & plots. Default is <INPUT_FASTA_FILE>_<SEQUENCE_HEADER>.
--identity <int>
Identity cutoff threshold. Must be greater than 50, less than 100.
-nc / --non-canonical
When counting k-mers, both forward and reverse complement are considered, with the smaller hash value selected. Using -nc will force selection of the forward strand only. This is not recommended for most applications.
By default, Mod.Plot will output a paired end bed file, along with plots for each sequence in each FASTA file as an image file (.png).
--no-bed
Skip output of bed file.
--no-plot
Skip output of svg and png image files.
--no-hist
Skip output of histogram legend.
--compare
Produce an a vs. b style dotplot. Can only be used when 2+ sequences are included.
--compare-only
Produce an a vs. b style dotplot without any individual dotplots.
--width
Adjust width of self dot plots. Default is 9 inches.
--height
Adjust height of self dot plots. Default is 5 inches for self-plots, 9 inches for a vs. b plots.
--dpi
Image resolution in dots per inch (not to be confiused with dotplot resolution). Default is 300.
--palette
List of accepted palettes can be found here. The syntax is to have the name of the palette, followed by an underscore with the number of colors, eg. OrRd_8. Default is Spectral_11.
--palette-orientation
Flip sequential order of color palette. Set to - by default for divergent palettes.
--bin-freq
By default, histograms are evenly spaced based on the number of colors and the identity threshold. Select this argument to bin based on the frequency of observed identity values.
Although deprecated, there is an R script you can use to plot directly from a bed file. ggplot2 and cowplot are required. You can call this Rscript through the following:
Rscript moddotplot/plot.r -b <BED_FILE> -p <OUTPUT_FOLDER>
With --bin-freq being an optional argument to specify histogram binning by frequency, as noted above.
To run Mod.Plot in interactive mode, use:
moddotplot -i INPUT_FASTA_FILE(S) --interactive
This will launch a Dash application on your machine's localhost. Open any web browser and go to http://127.0.0.1:<PORT_NUMBER> to view the interactive plot. The default port number used by Dash is 8050, but this can be customized using the --port command.
Running interactive mode on an HPC environment can be accomplished through the use of port forwarding. On your remote server, run Mod.Plot as normal:
moddotplot -i INPUT_FASTA_FILE(S) --interactive --port HPC_PORT_NUMBER
Then on your local machine, set up port forwarding run:
ssh -N -f -L LOCAL_PORT_NUMBER:127.0.0.1:HPC_PORT_NUMBER HPC@LOGIN.CREDENTIALS
You should now be able to view interactive mode using http://127.0.0.1:<LOCAL_PORT_NUMBER>. Note that your own HPC environment may have specific instructions and/or restrictions for setting up port forwarding.
$ moddotplot -i test/Chr1_cen.fa

 _______  _______  ______                        _______  _        _______ _________
(       )(  ___  )(  __  \                      (  ____ )( \      (  ___  )\__   __/
| () () || (   ) || (  \  )                     | (    )|| (      | (   ) |   ) (
| || || || |   | || |   ) |                     | (____)|| |      | |   | |   | |
| |(_)| || |   | || |   | |   ___   ___ _____   |  _____)| |      | |   | |   | |
| |   | || |   | || |   ) |  |   \ / _ \_   _|  | (      | |      | |   | |   | |
| )   ( || (___) || (__/  )  | |) | (_) || |    | )      | (____/\| (___) |   | |
|/     \|(_______)(______/   |___/ \___/ |_|    |/       (_______/(_______)   )_(


Retrieving k-mers from Chr1:14000000-18000000....

Chr1:14000000-18000000 k-mers retrieved!

Using s = 8.

Computing self identity matrix for Chr1:14000000-18000000...

Self identity matrix complete! Saved to Chr1:14000000-18000000.bed

Creating plots...

Plots created!

Saving plots to Chr1:14000000-18000000.png...

Chr1:14000000-18000000.png_TRI.png, Chr1:14000000-18000000.png_TRI.svg, Chr1:14000000-18000000.png_HIST.png and Chr1:14000000-18000000.png_HIST.svg, saved sucessfully.
$ moddotplot -i test/Chr1_cen.fa -s 32 --identity 85 --interactive

 _______  _______  ______                        _______  _        _______ _________
(       )(  ___  )(  __  \                      (  ____ )( \      (  ___  )\__   __/
| () () || (   ) || (  \  )                     | (    )|| (      | (   ) |   ) (
| || || || |   | || |   ) |                     | (____)|| |      | |   | |   | |
| |(_)| || |   | || |   | |   ___   ___ _____   |  _____)| |      | |   | |   | |
| |   | || |   | || |   ) |  |   \ / _ \_   _|  | (      | |      | |   | |   | |
| )   ( || (___) || (__/  )  | |) | (_) || |    | )      | (____/\| (___) |   | |
|/     \|(_______)(______/   |___/ \___/ |_|    |/       (_______/(_______)   )_(


Retrieving k-mers from Chr1:14000000-18000000....

Chr1:14000000-18000000 k-mers retrieved!

Dash is running on http://127.0.0.1:8050/

 * Serving Flask app 'moddotplot.interactive'
The plotly plot can be navigated using the zoom (magnifying glass) and pan (hand) icons. The current plot can be downloaded as an image with the camera icon. Depending on sparsity value, plots may need some time to refresh. The plot can be reset by double-clicking or selecting the home button. Set the lock resolution button to prevent auto-scaling using modimizers.
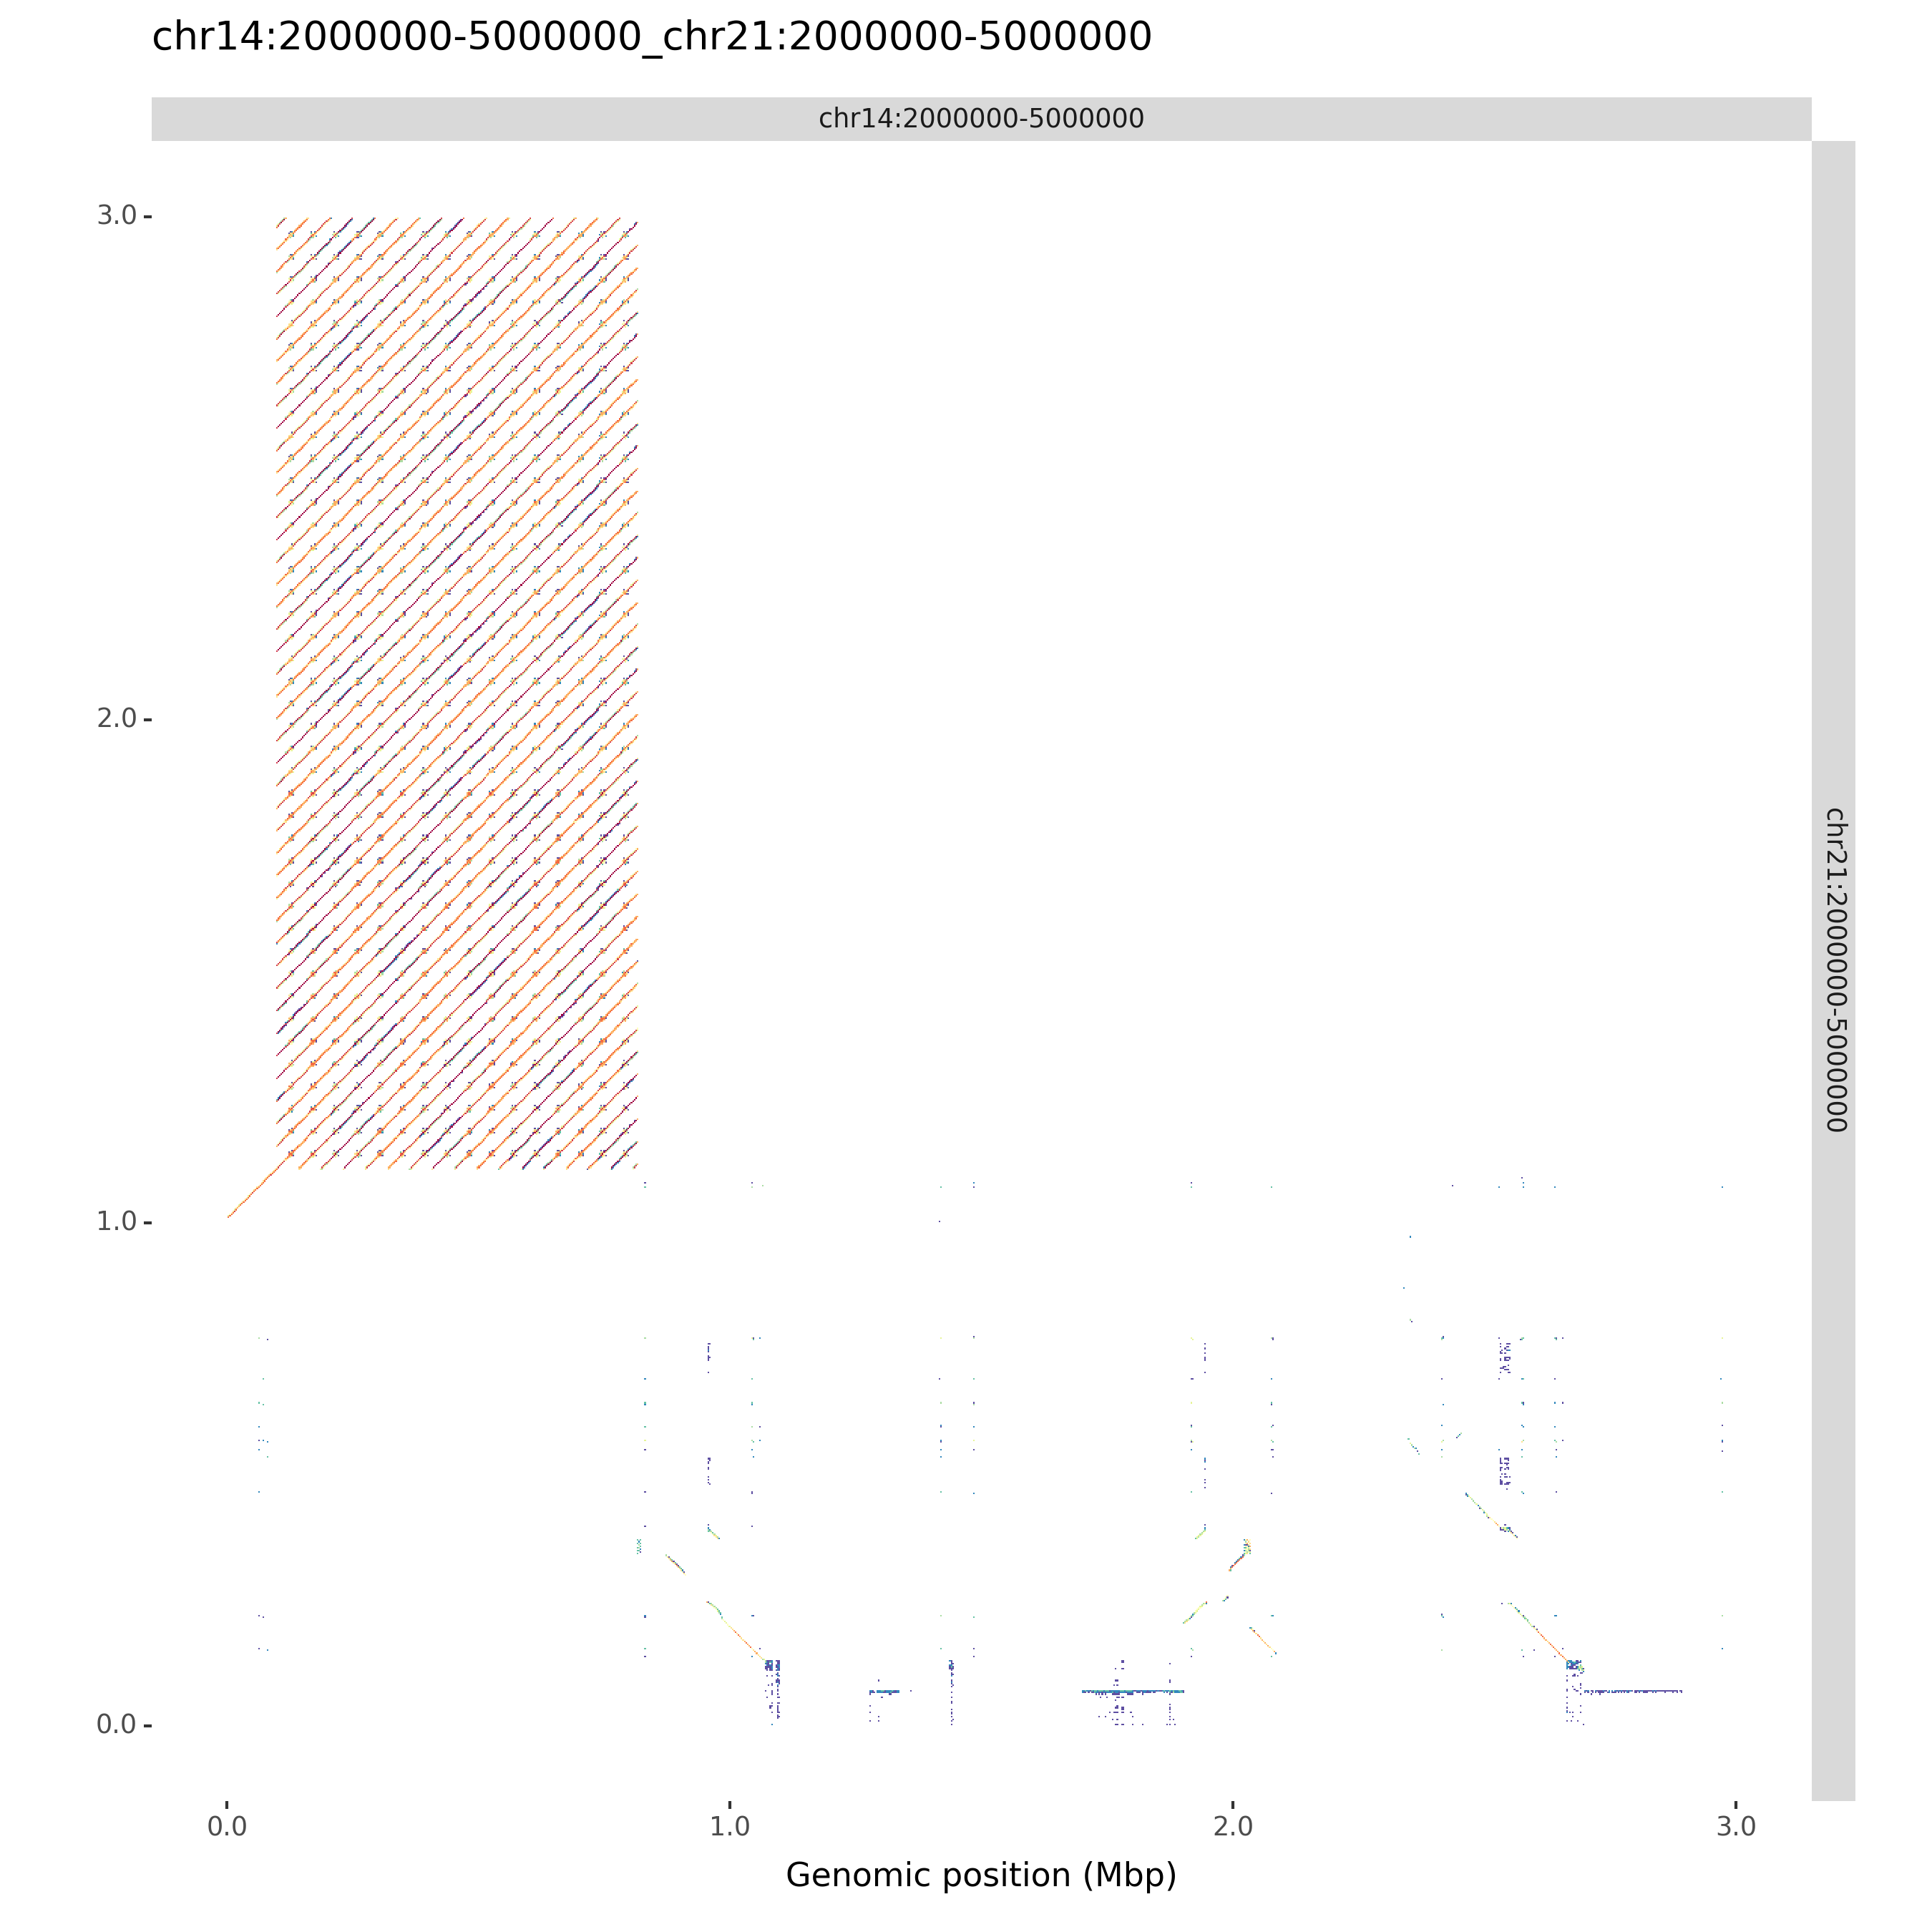
ModDotPlot can produce an a vs. b style dotplot for each pairwise combination of input sequences. Use the --compare command liene argument to include these plots. If you want to skip the creation of self-identity plots, you can use --compare-only:
moddotplot -i test/chr14_segment.fa test/chr21_segment.fa -id 88 --compare-only

 _______  _______  ______                        _______  _        _______ _________
(       )(  ___  )(  __  \                      (  ____ )( \      (  ___  )\__   __/
| () () || (   ) || (  \  )                     | (    )|| (      | (   ) |   ) (
| || || || |   | || |   ) |                     | (____)|| |      | |   | |   | |
| |(_)| || |   | || |   | |   ___   ___ _____   |  _____)| |      | |   | |   | |
| |   | || |   | || |   ) |  |   \ / _ \_   _|  | (      | |      | |   | |   | |
| )   ( || (___) || (__/  )  | |) | (_) || |    | )      | (____/\| (___) |   | |
|/     \|(_______)(______/   |___/ \___/ |_|    |/       (_______/(_______)   )_(


Retrieving k-mers from chr14:2000000-5000000....

chr14:2000000-5000000 k-mers retrieved!

Retrieving k-mers from chr21:2000000-5000000....

chr21:2000000-5000000 k-mers retrieved!

Using s = 6.

Computing chr14:2000000-5000000 vs. chr21:2000000-5000000...

Success! Bed file output to chr14:2000000-5000000_chr21:2000000-5000000.bed

Creating plots...

chr14:2000000-5000000_chr21:2000000-5000000.png and chr14:2000000-5000000_chr21:2000000-5000000.svg saved sucessfully.
For bug reports or general usage questions, please raise a GitHub issue, or email asweete1 at jhu dot edu
Mac users might encounter the following unexpected command line output:
/bin/sh: lscpu: command not found
This is a known issue with PlotNine, the Python plotting library used by ModDotPlot. This can be safely ignored.
Using --compare in interactive mode is noticeably slower than self-identity dotplotting. I'll be looking to optimize this functionality as soon as possible.
Publication in progress!


