everyday ggplot2 extension
‘everyday ggplot2 extension’ is a resource for people that want to get into ggplot2 extension but might not be confident of how to do so (‘absolute newcomers’). It introduces some new points of entry including in education materials (recipes) and networking/troubleshooting/celebrating/collaborating spaces.
‘Everyday’ is meant in the sense of ordinary – you don’t need to create a flashy ggplot2 extension for it to ‘count’. You don’t need to have lots of people using the extension. You don’t need the extension to be on CRAN or write a package for the extension. You don’t even need a hex sticker! It is nice if the extension does some work just for you or simply makes you happy. Package development know-how can be complementary to ggplot2 extension, but are NOT a prerequisite. Lack of package building knowledge shouldn’t hold back the extension curious!
‘Everyday’ is also meant in the sense of frequent – practicing ggplot2 extension will probably make you better at extension - you’ll be in a position to write that next handy extension once when you have more experience under your belt.
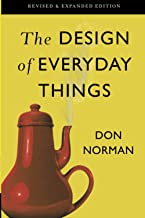
And, yes our title evokes, ‘The Design of Everyday Things’. We do want to thoughtfully design new avenues for bringing people into ggplot2 extension.
And we also recognize that we will make ‘Norman’ (poorly designed) ggplot2 extension along the way. And this is fine since mistakes can sometimes be more instructive and memorable than doing things ‘the right way’ the first time round.
knitr::include_graphics("design_of_everyday_things.jpg")It’s hard to imagine Norman’s book selling as well without the ill-conceived tea kettle gracing the cover. Expecting mistakes is another reason to make ggplot2 extension a less out-of-the-ordinary experience; past extensions feel less precious and we can part ways with them if appropriate. Curious to know if folks agree!
library(ggstamp)
library(ggplot2)
ggcanvas() +
  stamp_polygon(x0y0 = pos_honeycomb(n = 9),
                fill = "darkgoldenrod1") +
  stamp_text(label = c("ggxmean", "ggstamp", "ggols",
                       "ggsample", "ggcalendar",
                       "ggchalkb...", "ggquiet", "ggcirclepack",
                       "ggdirect"),
             xy = pos_honeycomb(n = 9), size = 5) +
  labs(title = "trying stuff out in ggplot2 extension",
       subtitle = "honeycombs are surprisingly strong structures",
       caption = "expert and experiment have the same latin root: 'experi', to try")
How do I know there’s an opportunity for extension?
The reason ggplot2 exists is explained by Hadley Wickham in an interview:
And, you know, I’d get a dataset. And, in my head I could very clearly kind of picture, I want to put this on the x-axis. Let’s put this on the y-axis, draw a line, put some points here, break it up by this variable. And then, like, getting that vision out of my head, and into reality, it’s just really, really hard. Just, like, felt harder than it should be. Like, there’s a lot of custom programming involved, where I just felt, like, to me, I just wanted to say, like, you know, this is what I’m thinking, this is how I’m picturing this plot. Like you’re the computer ‘Go and do it’. … and I’d also been reading about the Grammar of Graphics by Leland Wilkinson, I got to meet him a couple of times and … I was, like, this book has been, like, written for me. - https://www.trifacta.com/podcast/tidy-data-with-hadley-wickham/
To paraphrase, fact that ggplot2 is built on the grammar of graphics, with its ‘logically decomposed bits’, should let you fly through plot creation with ease. You can go from the plot you’ve already pictured in your head into reality by describing it.
After a good amount of time using ggplot2, you get used to this flying sensation. You’ve practiced and mastered the grammar. You are a composer of graphical poems. You confidently speak plots into existence. Poetry slam!
But then one day you may find yourself with a loss for graphical words within ggplot2. At some point ggplot2 will seem to fail to give you the fluid ggplot2 experience. One day you will find yourself saying, ’Why aren’t I flying?" This might be a moment to double-check your grammar prowess; or it might be a moment to turn to ggplot2 extension(s)!
If, after browsing existing extensions, the extensions
gallery and the Awesome
ggplot2 repository,
you can’t find what you need to fly again, you can consider creating
your own extension.
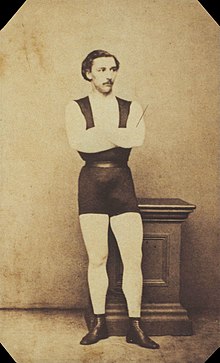
knitr::include_graphics("jules_leotard.jpeg", )To summarize, here are some situations that indicate there might be a ggplot2 extension opportunity:
- I don’t feel like I’m flying; but usually I do
- My brain hurts because of the plot I’m trying to build; but usually it’s happy or
- ‘getting that vision out of my head, and into reality, it’s just really, really hard… harder than it should be.’
library(gganatogram)
#> Loading required package: ggpolypath
gganatogram(data=hgFemale_key, outline = T,
            fillOutline='#a6bddb',
            organism='human', sex='female', fill="colour")  +
  ggstamp::stamp_wash(alpha = .8) +
  geom_polygon(data = hgFemale_list$brain, aes(x = x, y = -y),
            fill = "red") +
  coord_equal() +
  stamp_text_ljust(label = "Ouch!", angle = 5)
#> Warning in annotate(geom = "rect", xmin = xmin, ymin = ymin, xmax = xmax, :
#> Ignoring unknown aesthetics: x and y
# brainstorming a stamp (annotation) layer for the brain...
stamp_female_brain <- function(...){
geom_polygon(data = hgFemale_list$brain, aes(x = x, y = -y),...)
# could be polygon
}A new ‘easy recipes’ approach: Taste, succeed, minimally modify
layer extension recipes take the form:
- Step 0. Get the job done with ‘base’ ggplot2. It’s a good idea to clarify what needs to happen without getting into the extension architecture
- Step 1. Write a computation function. Wrap the necessary computation into a function.
- Step 2. Define a ggproto object. ggproto objects allow your extension to work together with base ggplot2 functions! You’ll use the computation function from step 1 to help define it.
- Step 3. Write your geom/stat_* function! You’re ready to write your function. You will incorporate the ggproto from step 2.
- Step 4. Test/Enjoy! Take your new geom for a spin! Check out group-wise computation behavior!
compute_group recipes and tutorial
-
compute_panel recipes and tutorial
-
ggextend: browseable, minimal working examples
Communities of practice
Communities of practice can help motivate and sustain productivity of projects. While
- stalwarts; long-time ggplot2 extenders and developers
‘everyday ggplot2 extension’ would like to point you to new communities of practice – places were you can share work and frustrations in the ggplot2 world:
- warming up; [https://github.com/teunbrand/ggplot-extension-club]
I’m hopeful that an ‘absolute newcomers’ group may develop; this could consist of ggplot2 super-users, no extension experience tutorial evaluation is underway and focus group may seed absolute newcomers group and their collaborators (is it cool and fun to explore the ggplot2 extension space w/ absolute newcomers to ggplot2 and R - yes it is!). It might spin off of the focus groups for the ‘easy geom recipes’ evaluation.
‘everyday ggplot2 extension’ promotes the ‘warming up’ group and aspires to serve an ‘absolute newcomers’ group; and to promote cross pollination between groups.
- ggpuzzles is a place to demo minimal not-yet-working examples. Extenders can share their good ideas which maybe they don’t have quite the skills or knowledge to execute on; or maybe they are just missing a comma! The ggproto tag on StackOverflow is similar but might be dominated by more advanced users.
Subject areas of application
-
stats101verse
- [ggxmean]
- [ggols]
- [ggsample]
- [ma206data]
- [ma206distributions]
- [ma206equations]
I am told there are people that don’t care for maps, and I find it hard to believe. Robert Louis Stevenson
-
[ggamericas] is an experiment in the geomSf-inheritance space, seeking to foster cross-package synergies, lessons learned, and emergance of best practices. The following packages are in the works and are proposed as early guides in this space:
-
[ggatlases], explorations of non geographic atlases
- ggbrain.experiment
- gganatomy.experiment
- ggteeth.experiment
-
counting things
- tidypivot
- ggcirclepack
Shiny linkage…
- [codequoteforshiny] When you just want to talk about and manipulate the contents of a plot and not dig into the weeds of how to get there, shiny apps are great! But if you are writing tools to make ggplot2 interfaces that make the code a closer match with how we think about the plot “getting the picture out of our heads”, than you’ll probably also want to quote the code! Looking at the code shouldn’t feel too “in the weeds” because of the grammar of graphic’s conceptual mapping – and your attention to conceptual mapping!
Beyond ‘everyday ggplot2 extension’
Any ‘everyday’ ggplot2 extender should also be aware of other invaluable learning resources (compiled by Teun Van Der Brand):
-
The extending ggplot2 vignette
-
The extending ggplot2 chapters of the ggplot2 book:
- Chapter 19: Programming with ggplot2
- Chapter 20: ggplot2 internals
- Chapter 21: Writing ggplot2 extensions
- Chapter 22: Case Study: Springs
-
The ggproto tag on StackOverflow
-
Extending your ability to extend ggplot2 by Thomas Lin Pederson at rstudio::conf 2020
-
Cracking open ggplot internals with {ggtrace} by June Choe at rstudio::conf 2022
-
Best practises for programming with ggplot2 by Dewey Dunnington at rstudio::conf 2020


