This is a simple framework for single / multiple reaction enzyme kinetics simulation and plotting. It allows one to plot reaction kinetics that follows the reversible Michaelis - Menten model.
pip install kinetix
One can use the library to produce figures via a command line interface or programmatically (see below for examples)
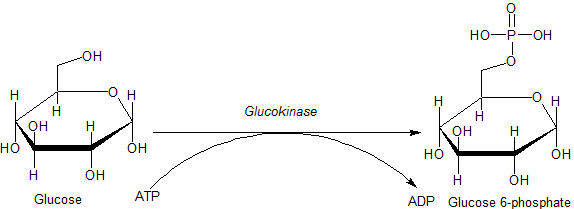
As an example, the reaction kinetics of Glucose Kinase (EC: 2.7.1.2 is displayed as an example)
First, create a definition file in YAML format, that defines the reaction parameters:name: "Glucose kinase simulation"
reactants: #Concentration of the reactants at the beginning of the reaction (mM)
glucose: 0.2
glucose_6_p: 0.0
enzymes: #Concentration of the enzyme(s) at the begining of the reaction (mM)
gluk: 0.05
reaction: #Kinetic parameters of each of the enzymes for the forward and backward steps of the (reversible) reaction. Note that non-reversible reactions can simple be modeled with high Km for on of the directions.
gluk:
fwd: "glucose_6_p"
back: "glucose"
km_fwd: 0.24
km_back: 21
kcat_fwd: 61
kcat_back: 15.9Then, run the simulation with a simple command line and a few arguments:
kinetix glucose_kinase.yaml --plot_out gluc.png --csv_out gluc.csv
A figure showing the progression of the reaction as a function of time is generated:
A csv file containing the data used to generate the figure can also optionally be generated and saved (using the --csv_out flag)
Kinetix can also simulate a pathway composed of several enzymes. This example shows a pathway composed of 3 different enzymes used in the production of allulose (D-psicose) a C3 epimer of fructose:
- Fructose kinase (for the production of fructose-6-phosphate)
- D-psicose-3-epimerase (converting fructose-6-phosphate to allulose-6-phosphate)
- Alkaline phosphatase (converting allulose-6-phosphate to allulose)
The flow is similar to the one-enzyme case. First, define a yaml file with all the parameters:
---
name: "Allulose synthesis from fructose"
reactants:
  fructose: 1.8
  fructose_6_p: 0.0
  allulose: 0.0
  allulose_6_p: 0.0
enzymes:
  fruk: 0.05
  alsE: 0.05
  phosphatase: 0.05
reaction:
  fruk:
    fwd: "fructose_6_p"
    back: "fructose"
    km_fwd: 0.24
    km_back: 21
    kcat_fwd: 61
    kcat_back: 15.9
  alsE:
    fwd: "allulose_6_p"
    back: "fructose_6_p"
    km_fwd: 1.6
    km_back: 1.6
    kcat_fwd: 46
    kcat_back: 46
  phosphatase:
    fwd: "allulose"
    back: "allulose_6_p"
    km_fwd: 1
    km_back: 100
    kcat_fwd: 100
    kcat_back: 1
Then, invoke the application just as before:
kinetix allulose.yaml --plot_out examples/figures/alu.svg --csv_out examples/csvs/alu.csv
To produce the reaction figure, which displays the concentration of each of the reactants as a function of time:
Kinetix also makes it really easy to simulate and plot a reaction more flexibly via a simple API. Example:
Kinetix/examples/programmatic.py
Lines 8 to 44 in 4d1107d
