#kmerspectrumanalyzer
This package contains scripts that summarize, visualize, and interpret the kmer spectrum (the histogram of abundances of oligonucleotide patterns of fixed length) of short-read sequence datasets.
This tool counts the numbers of occurrences of long kmers
in a short-read dataset, which must be provided as a single
fasta or fastq file, producing a small kmer repeat histogram.
The kmerspectrumanalyzer.py and plotkmerspectrum.py scripts
prodvide visualizations and fits of this kmer spectrum.
This package depends on numpy, scipy, matplotlib, and the University of Maryland's Jellyfish kmer counting library.
- numpy http://www.numpy.org/
- scipy http://www.scipy.org/
- matplotlib http://www.matplotlib.org/
- jellyfish > 1.1.5; tested with 1.1.11 and 2.2.6 http://www.cbcb.umd.edu/software/jellyfish/
kmerspectrumanalyzer is under the BSD license; see LICENSE. Distribution, modification and redistribution, incorporation into other software, and pretty much everything else is allowed.
- src -- contains scripts
- pfge_analysis -- PFGE gel images (and analysis once generated)
- repeatresolutionpaper -- contains data supporting the paper
- test -- example invokations and testing scripts
This package contains a wrapper script (kmer-tool2) to count
long (k=21 default) kmers in fasta or fastq files using jellyfish.
The resulting summaries, known as "kmer spectra" or "kmer histograms"
are compact tables of number that summarize the redundancy of the
sequence data. The following scripts process the kmer histograms:
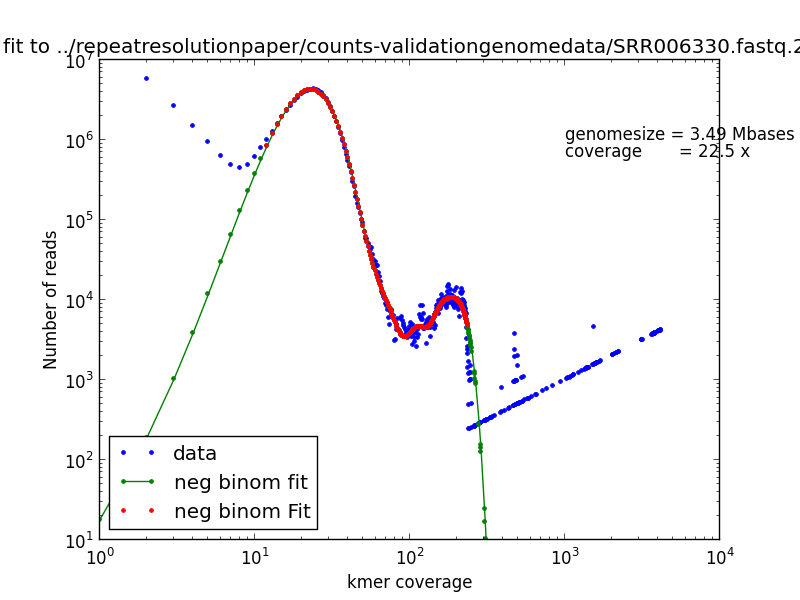
plotkmerspectrum.pyproduces graphs of one or more kmer spectra with a variety of transformations to facilitate interpretationkmerspectrumanalyzer.pyimplements maximum-likelihood fitting to a mixed-poisson model; if you have a single, well-behaved genome with more than 30x coverage, this will estimate genome size and kmer abundance.
Presuming you have sequence data in a pile of fastq files. First
we will count the 21mers in each file:
count-kmer21.sh *.fastq
This creates a list of files ending in .fastq.21 that contain only
numbers.
In repeatresolutionpaper/counts-validationgenomedata there is a
collection of 21 such kmer spectra. list contains two columns, the
first three lines of which are:
SRR039966A.fastq.21     T.paraluiscuniculi 22x
SRR006331.fastq.21      M.agalactiae 22x
SRR006330.fastq.21      A.baylyi 23x
This first column contains the filenames of the spectra; the second (optional) column contains a human readable name for the datasets; the third (optional) column contains the color of the trace.
These lines will generate graphs comparing the kmer spectra:
plotkmerspectrum -l list -g 1   # generates list.1.pdf
plotkmerspectrum -l list -g 5   # generates list.5.pdf
plotkmerspectrum -l list -g 6   # generates list.6.pdf
These lines will generate graphical summaries of depth and sequnece amount, stratified by bands of depth:
stratify.py -l list  -g 0 -o list.frac3.pdf
stratify.py -l list  -g 1 -o list.size3.pdf
stratify.py -l list  -g 0 -s -o list.frac3s.pdf
stratify.py -l list  -g 1 -s -o list.size3s.pdf
A paper describing kmerspectrumanalyzer was published August 2013 in BMC Genomics. 2013 14(1):537
- "Rapid quantification of sequence repeats to resolve the size, structure and contents of bacterial genomes." Williams D, Trimble WL, Shilts M, Meyer F, and Ochman H. PMID: 23924250 The manuscript can be found in repeatresolutionpaper/manuscript.
- Will Trimble (Argonne National Laboratory)
- Travis Harrison (Argonne National Laboratory)
- David Williams (Yale University)
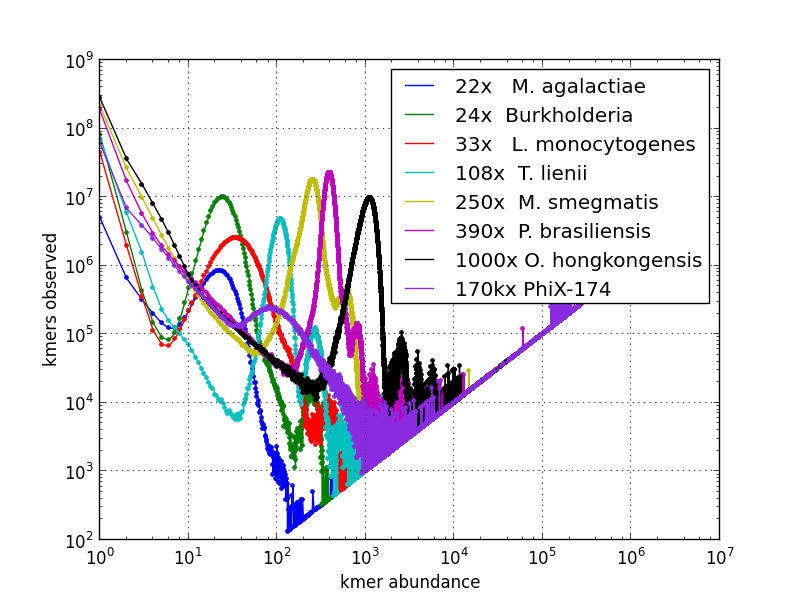
Kmer spectrum visualization for selected genome sequencing runs:
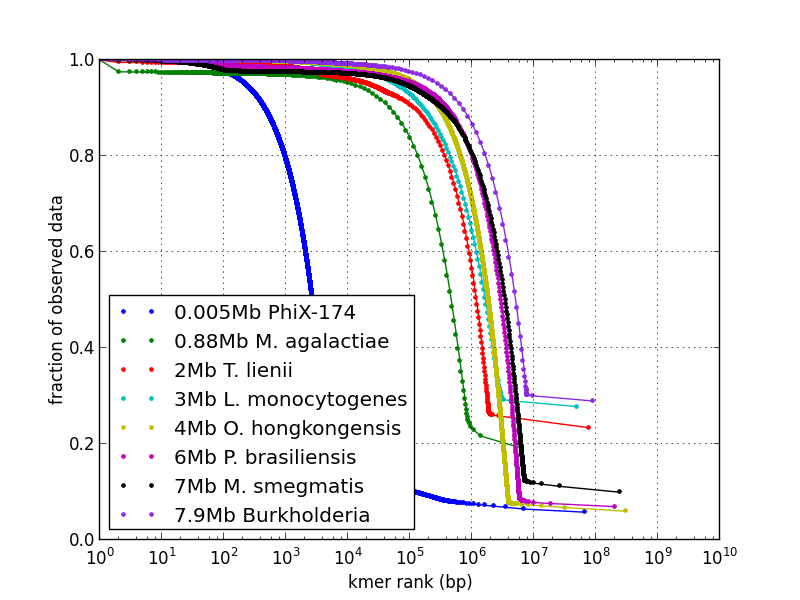
 Cumulative kmer spectrum showing genome size and solid fraction:
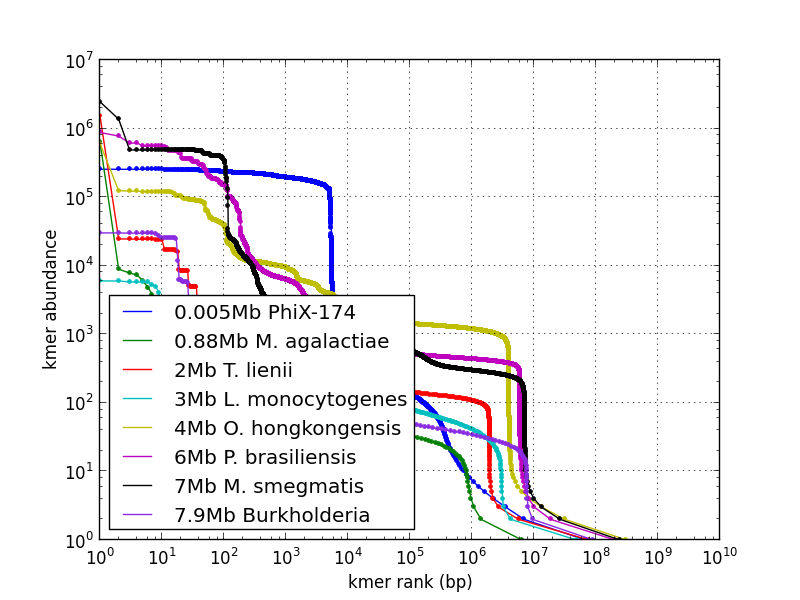
 Cumulative kmer spectrum showing genome size and coverage:
 Example genome size, coverage fit:
