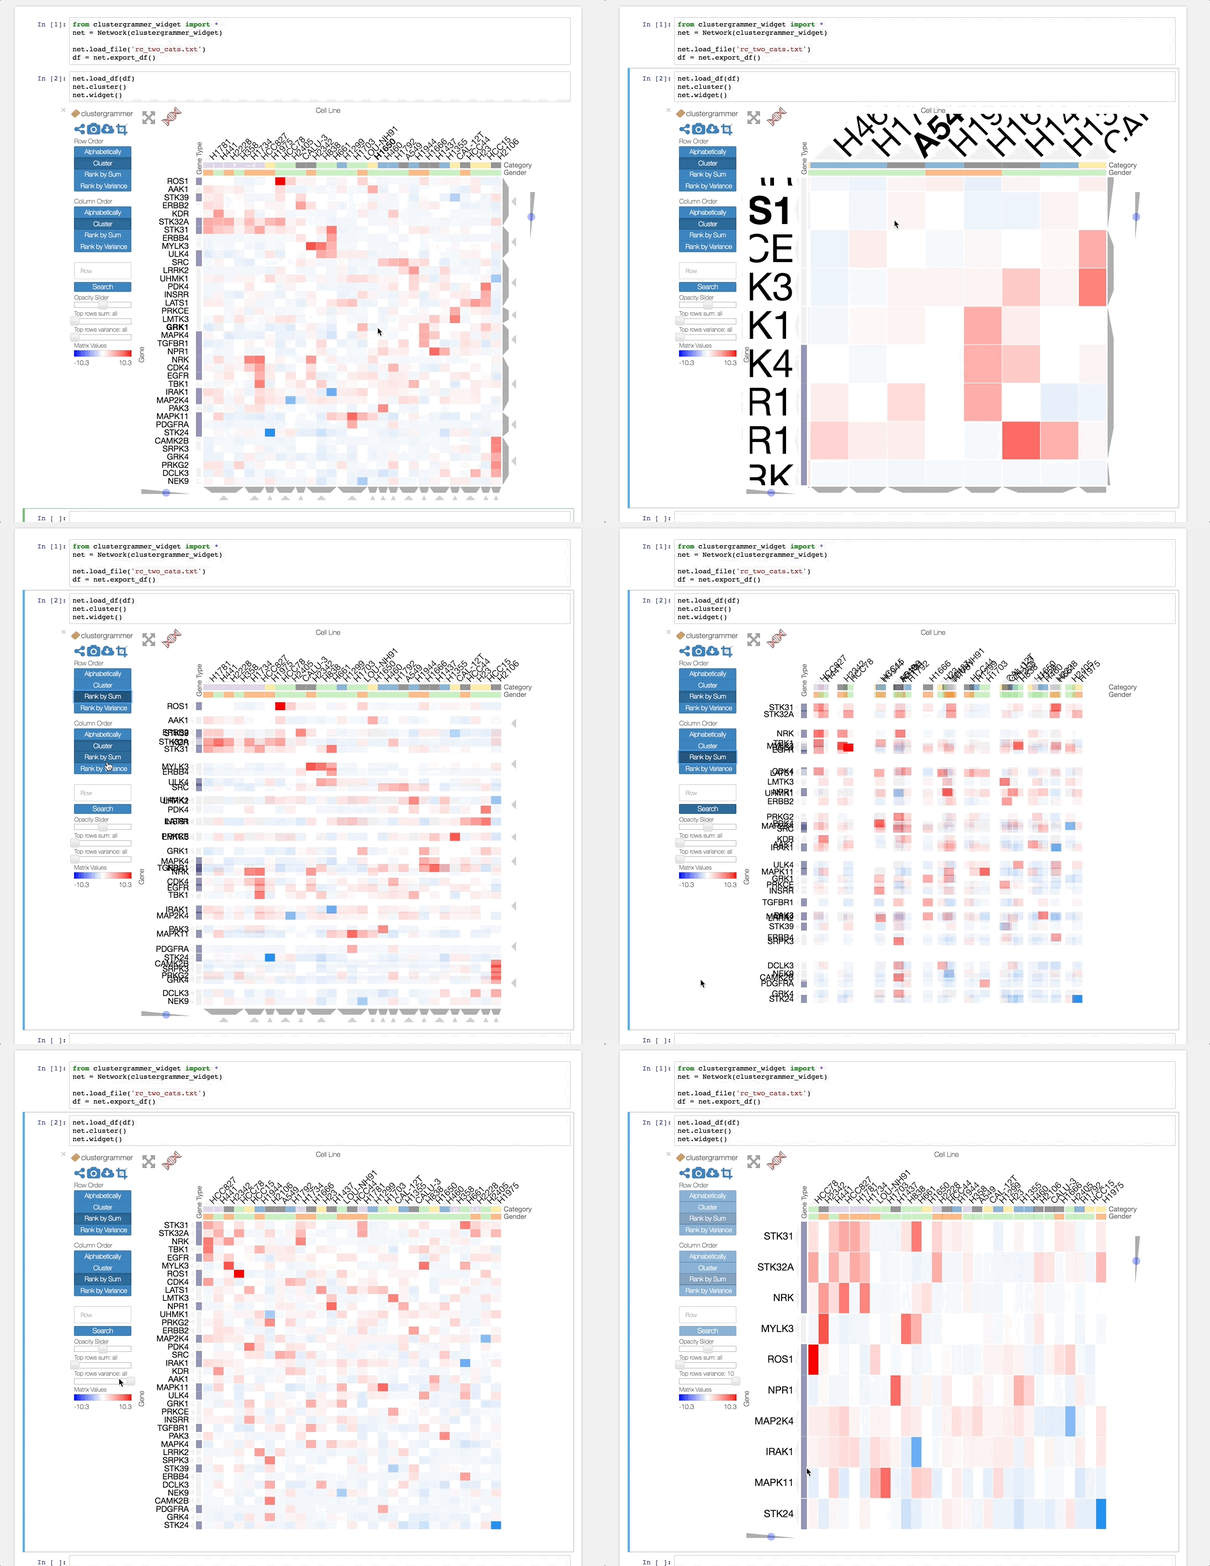
This is a Jupyter notebook interactive widget implementation of the interactive heatmap tool Clustergrammer. The front-end visualization, clustergrammer.js is built using D3.js and the back-end, clustergrammer.py is built in Python.
Please refer to the Clustergrammer-Widget documentation for more information or click on the screenshot below to see an example notebook.
The interactive widget can be installed and enabled using the following commands:
pip install clustergrammer_widget
jupyter nbextension enable --py --sys-prefix widgetsnbextension
jupyter nbextension enable --py --sys-prefix clustergrammer_widget
- Numpy
- Scipy
- Pandas
Clustergrammer-widget is compatable with Python 2 and 3.
The Clustergrammer-widget can be used to visualize a matrix of your data in the TSV format described here.
Within the Jupyter/IPython notebook the widget can be run using the following commands
# import the widget
from clustergrammer_widget import *

# load data into new network instance and cluster
net = Network(clustergrammer_widget)
net.load_file('rc_two_cats.txt')
net.cluster()

# view the results as a widget
net.widget()
The Clustergrammer-Widget has been applied to a wide variety of biological and non-biological data. Refer to the Jupyter notebook examples below and Case Studies and Examples for more information:
- Running Clustergrammer Widget
- DataFrame Example
- CCLE Jupyter Notebook
- Lung Cancer PTM and Gene Expression Regulation
- Single-Cell CyTOF Data
- MNIST Notebook
- USDA Nutrient Dataset
- Iris Dataset
For a development installation (requires npm),
$ git clone https://github.com/maayanlab/clustergrammer-widget.git
$ cd clustergrammer-widget
$ pip install -e .
$ jupyter nbextension install --py --symlink --user clustergrammer_widget
$ jupyter nbextension enable --py --user clustergrammer_widget
