This project gathers different plotting routines for .csv-like data sources. It makes use of numpy, matplotlib and pylab.
Adapt the python files to your purposes or even use the existing code to plot your data.
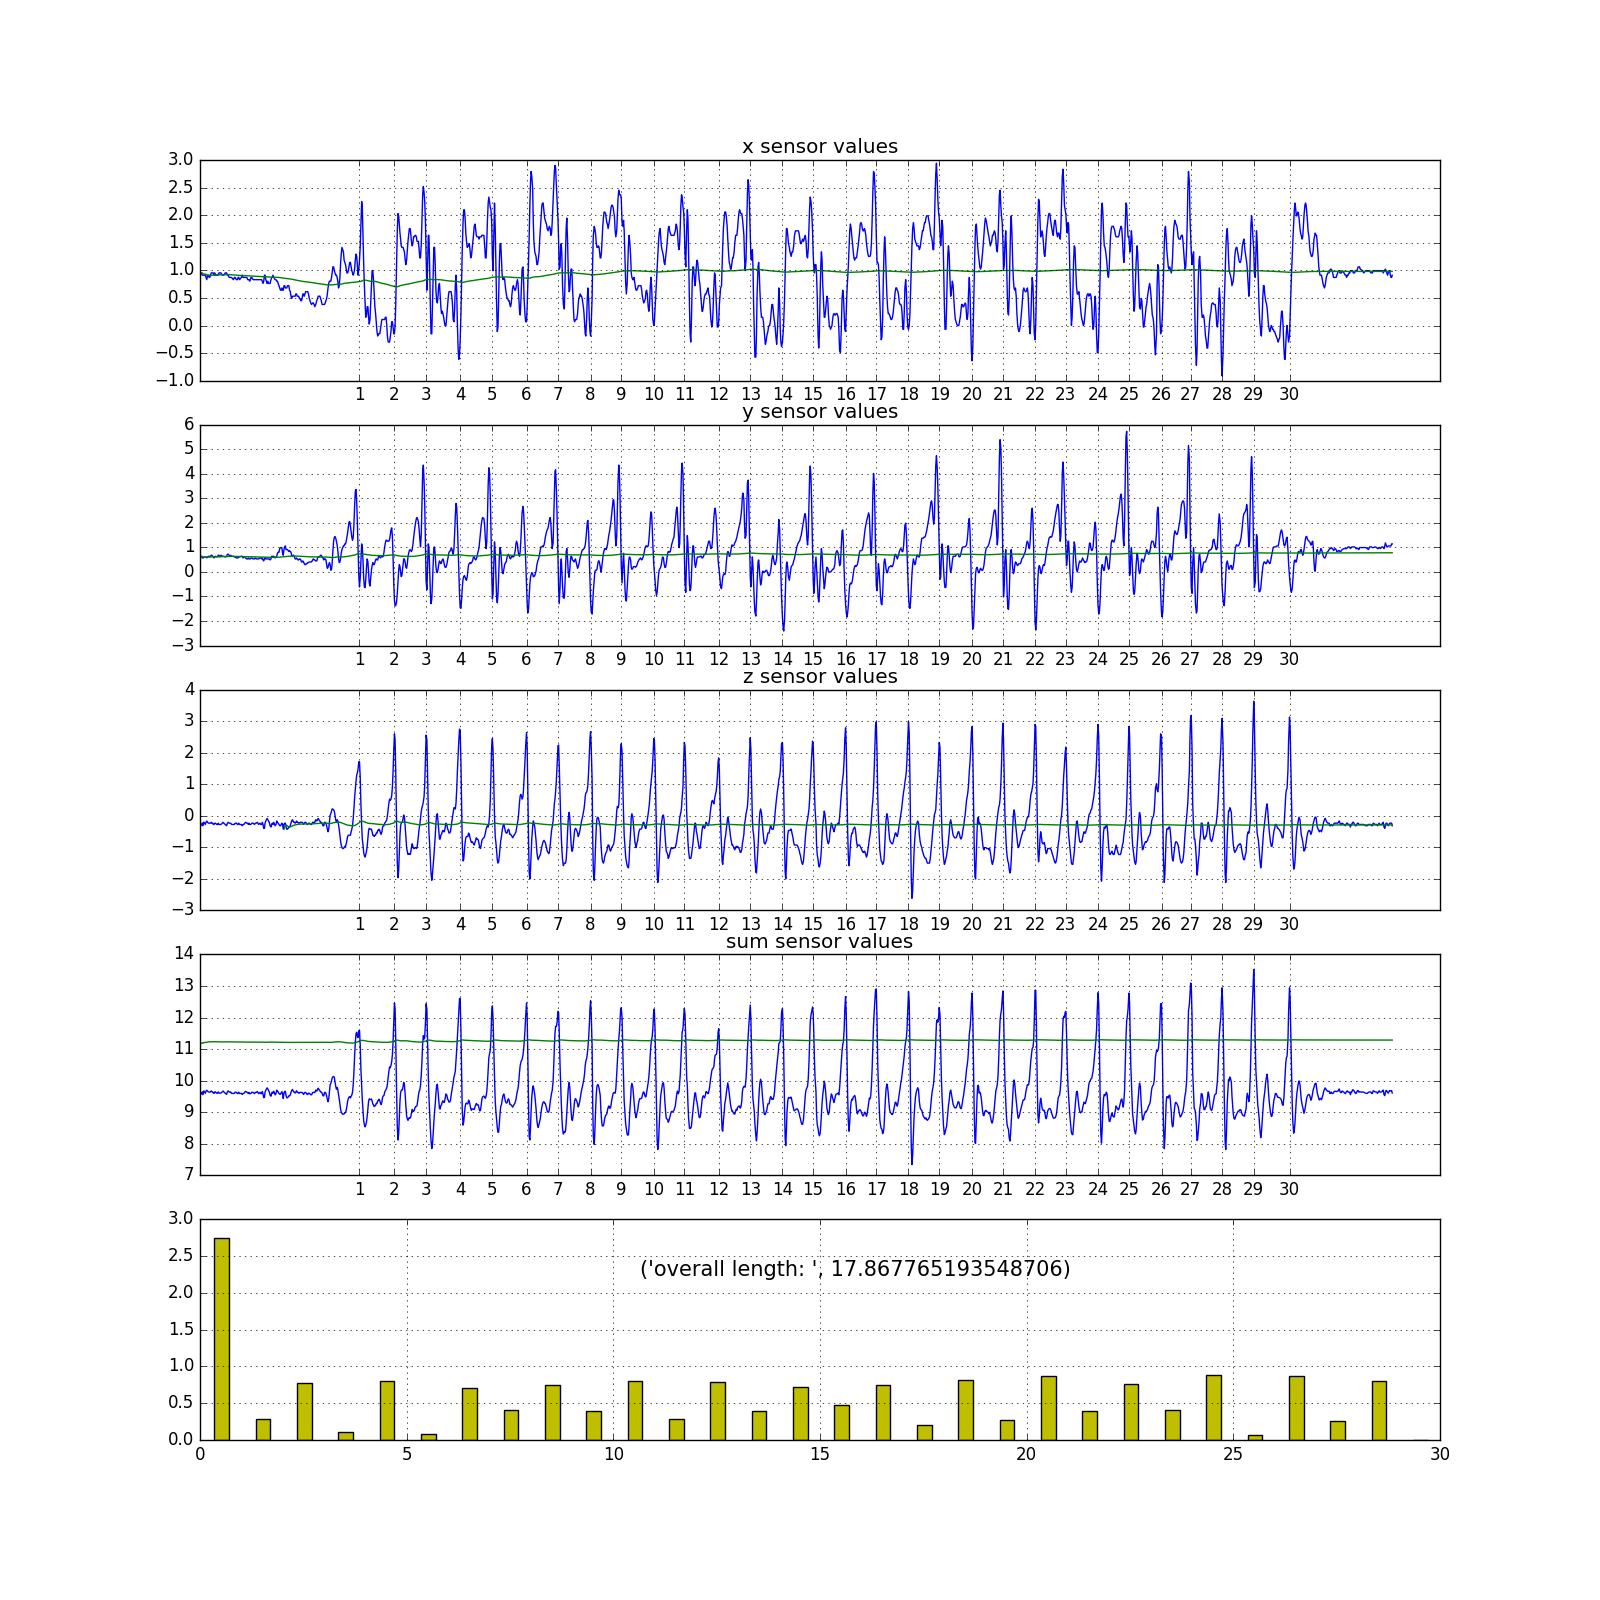
Simple pedestrian step counting implementation to analyse IMU data from Android phone.

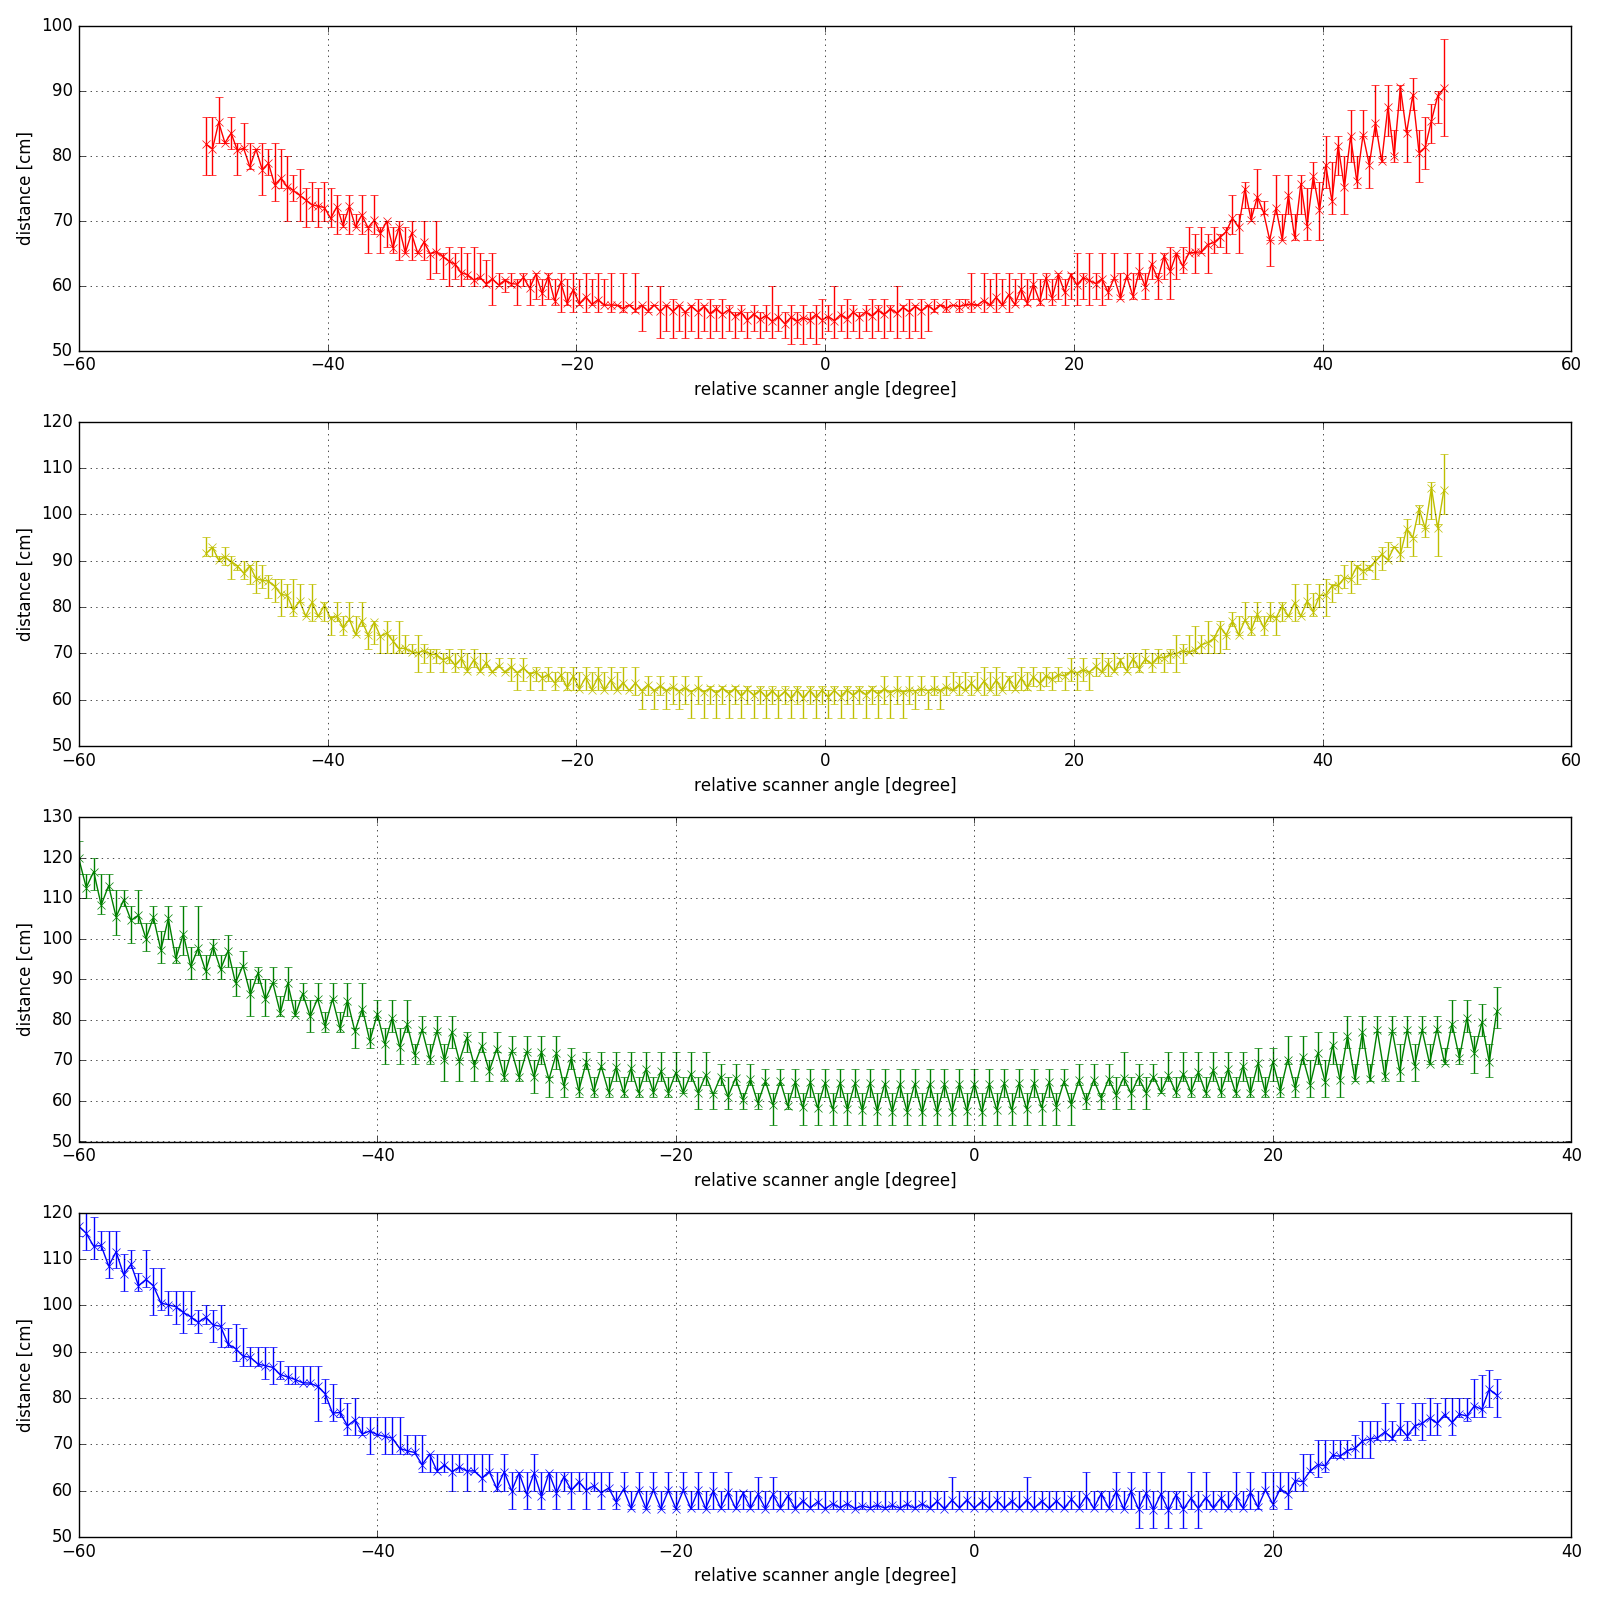
Visualize error characteristics from an Ibeo Lux4 LiDAR sensor.

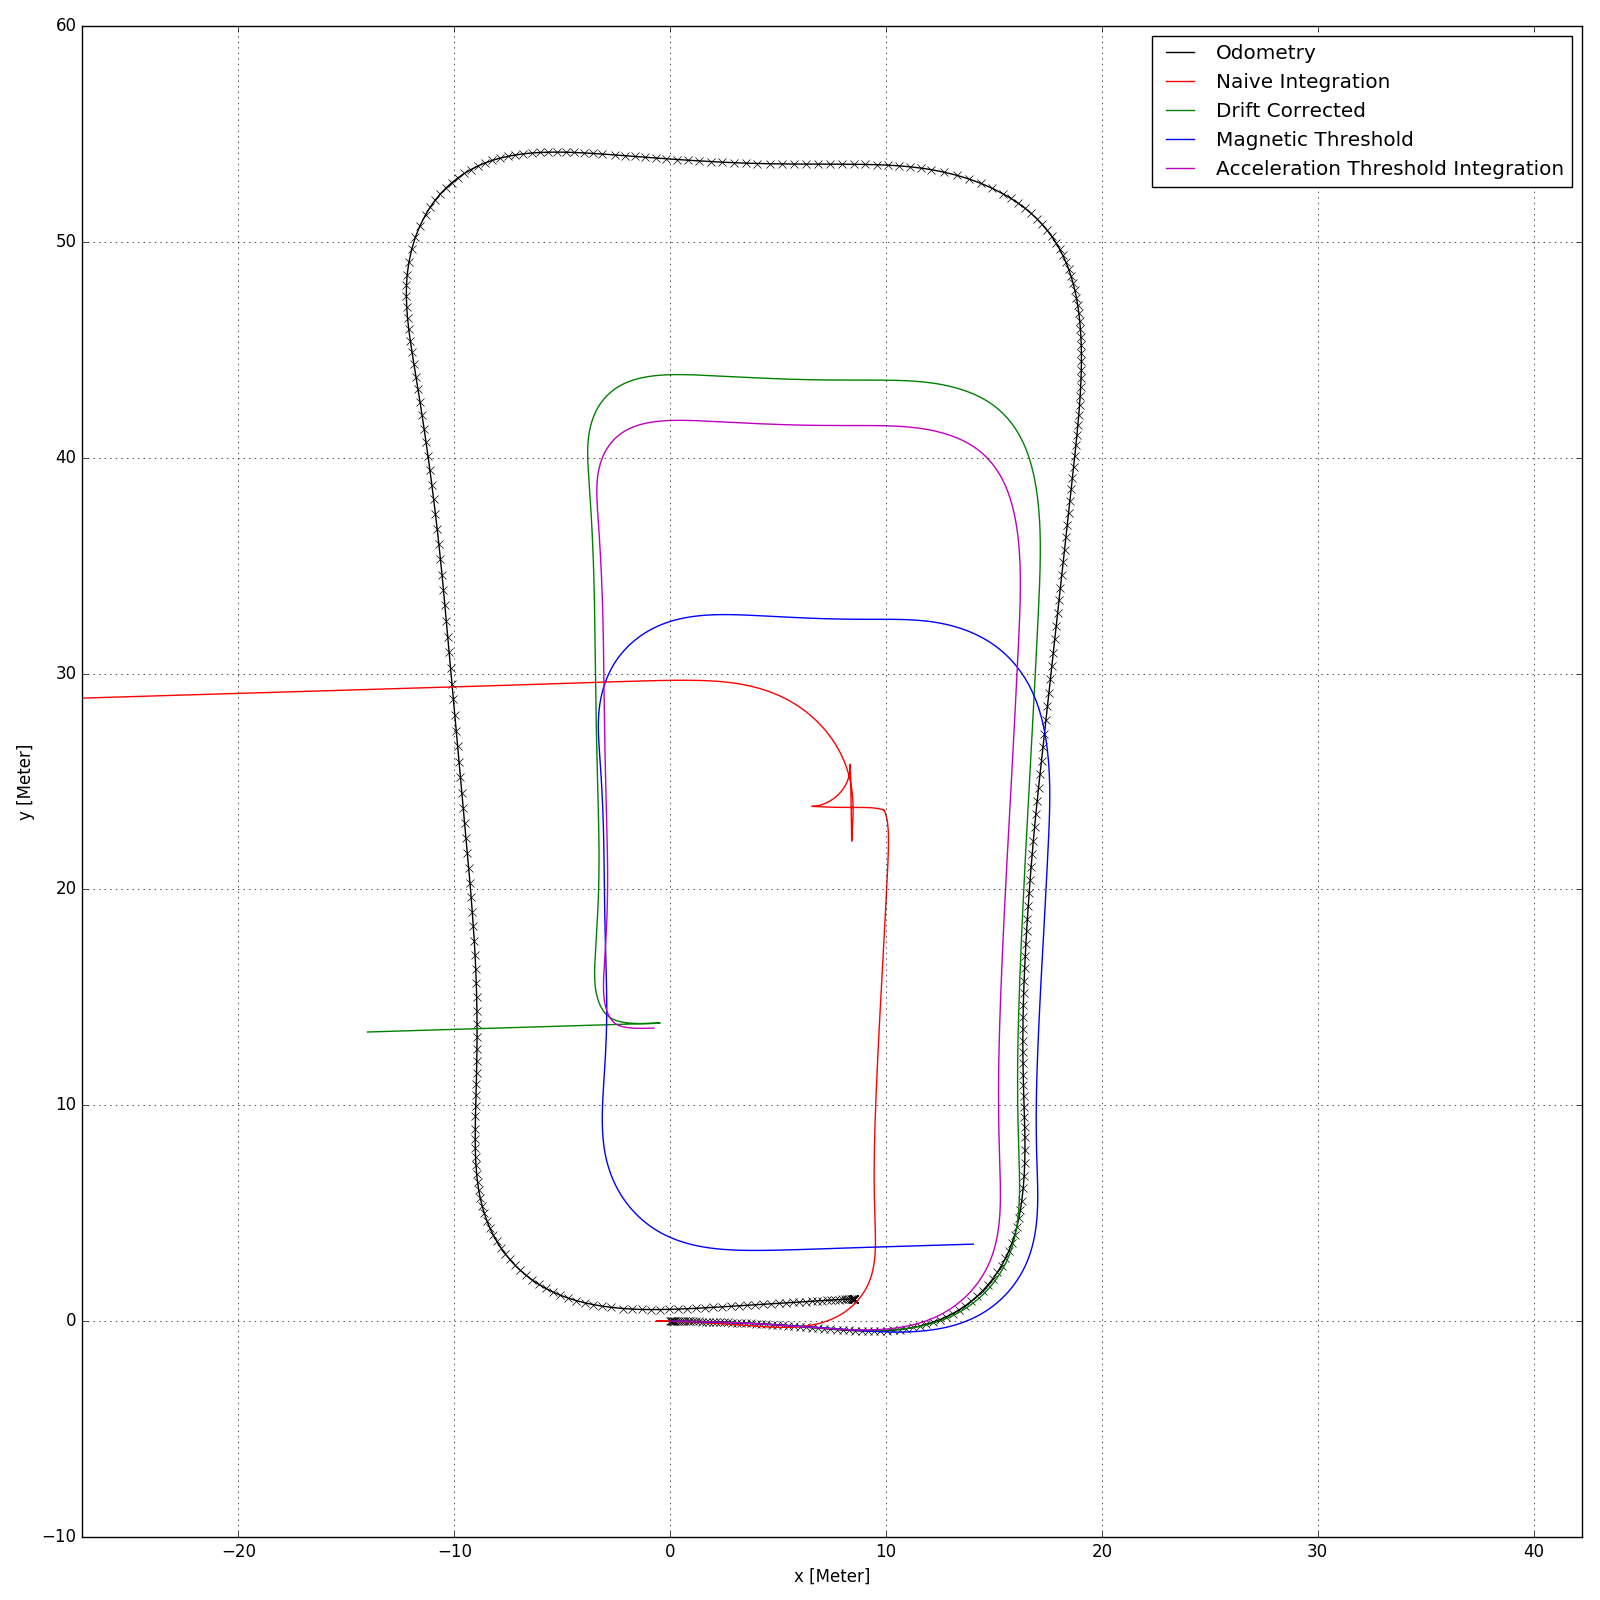
Visualize the error growth when integrating IMU data versus odometry from wheel encoders.
