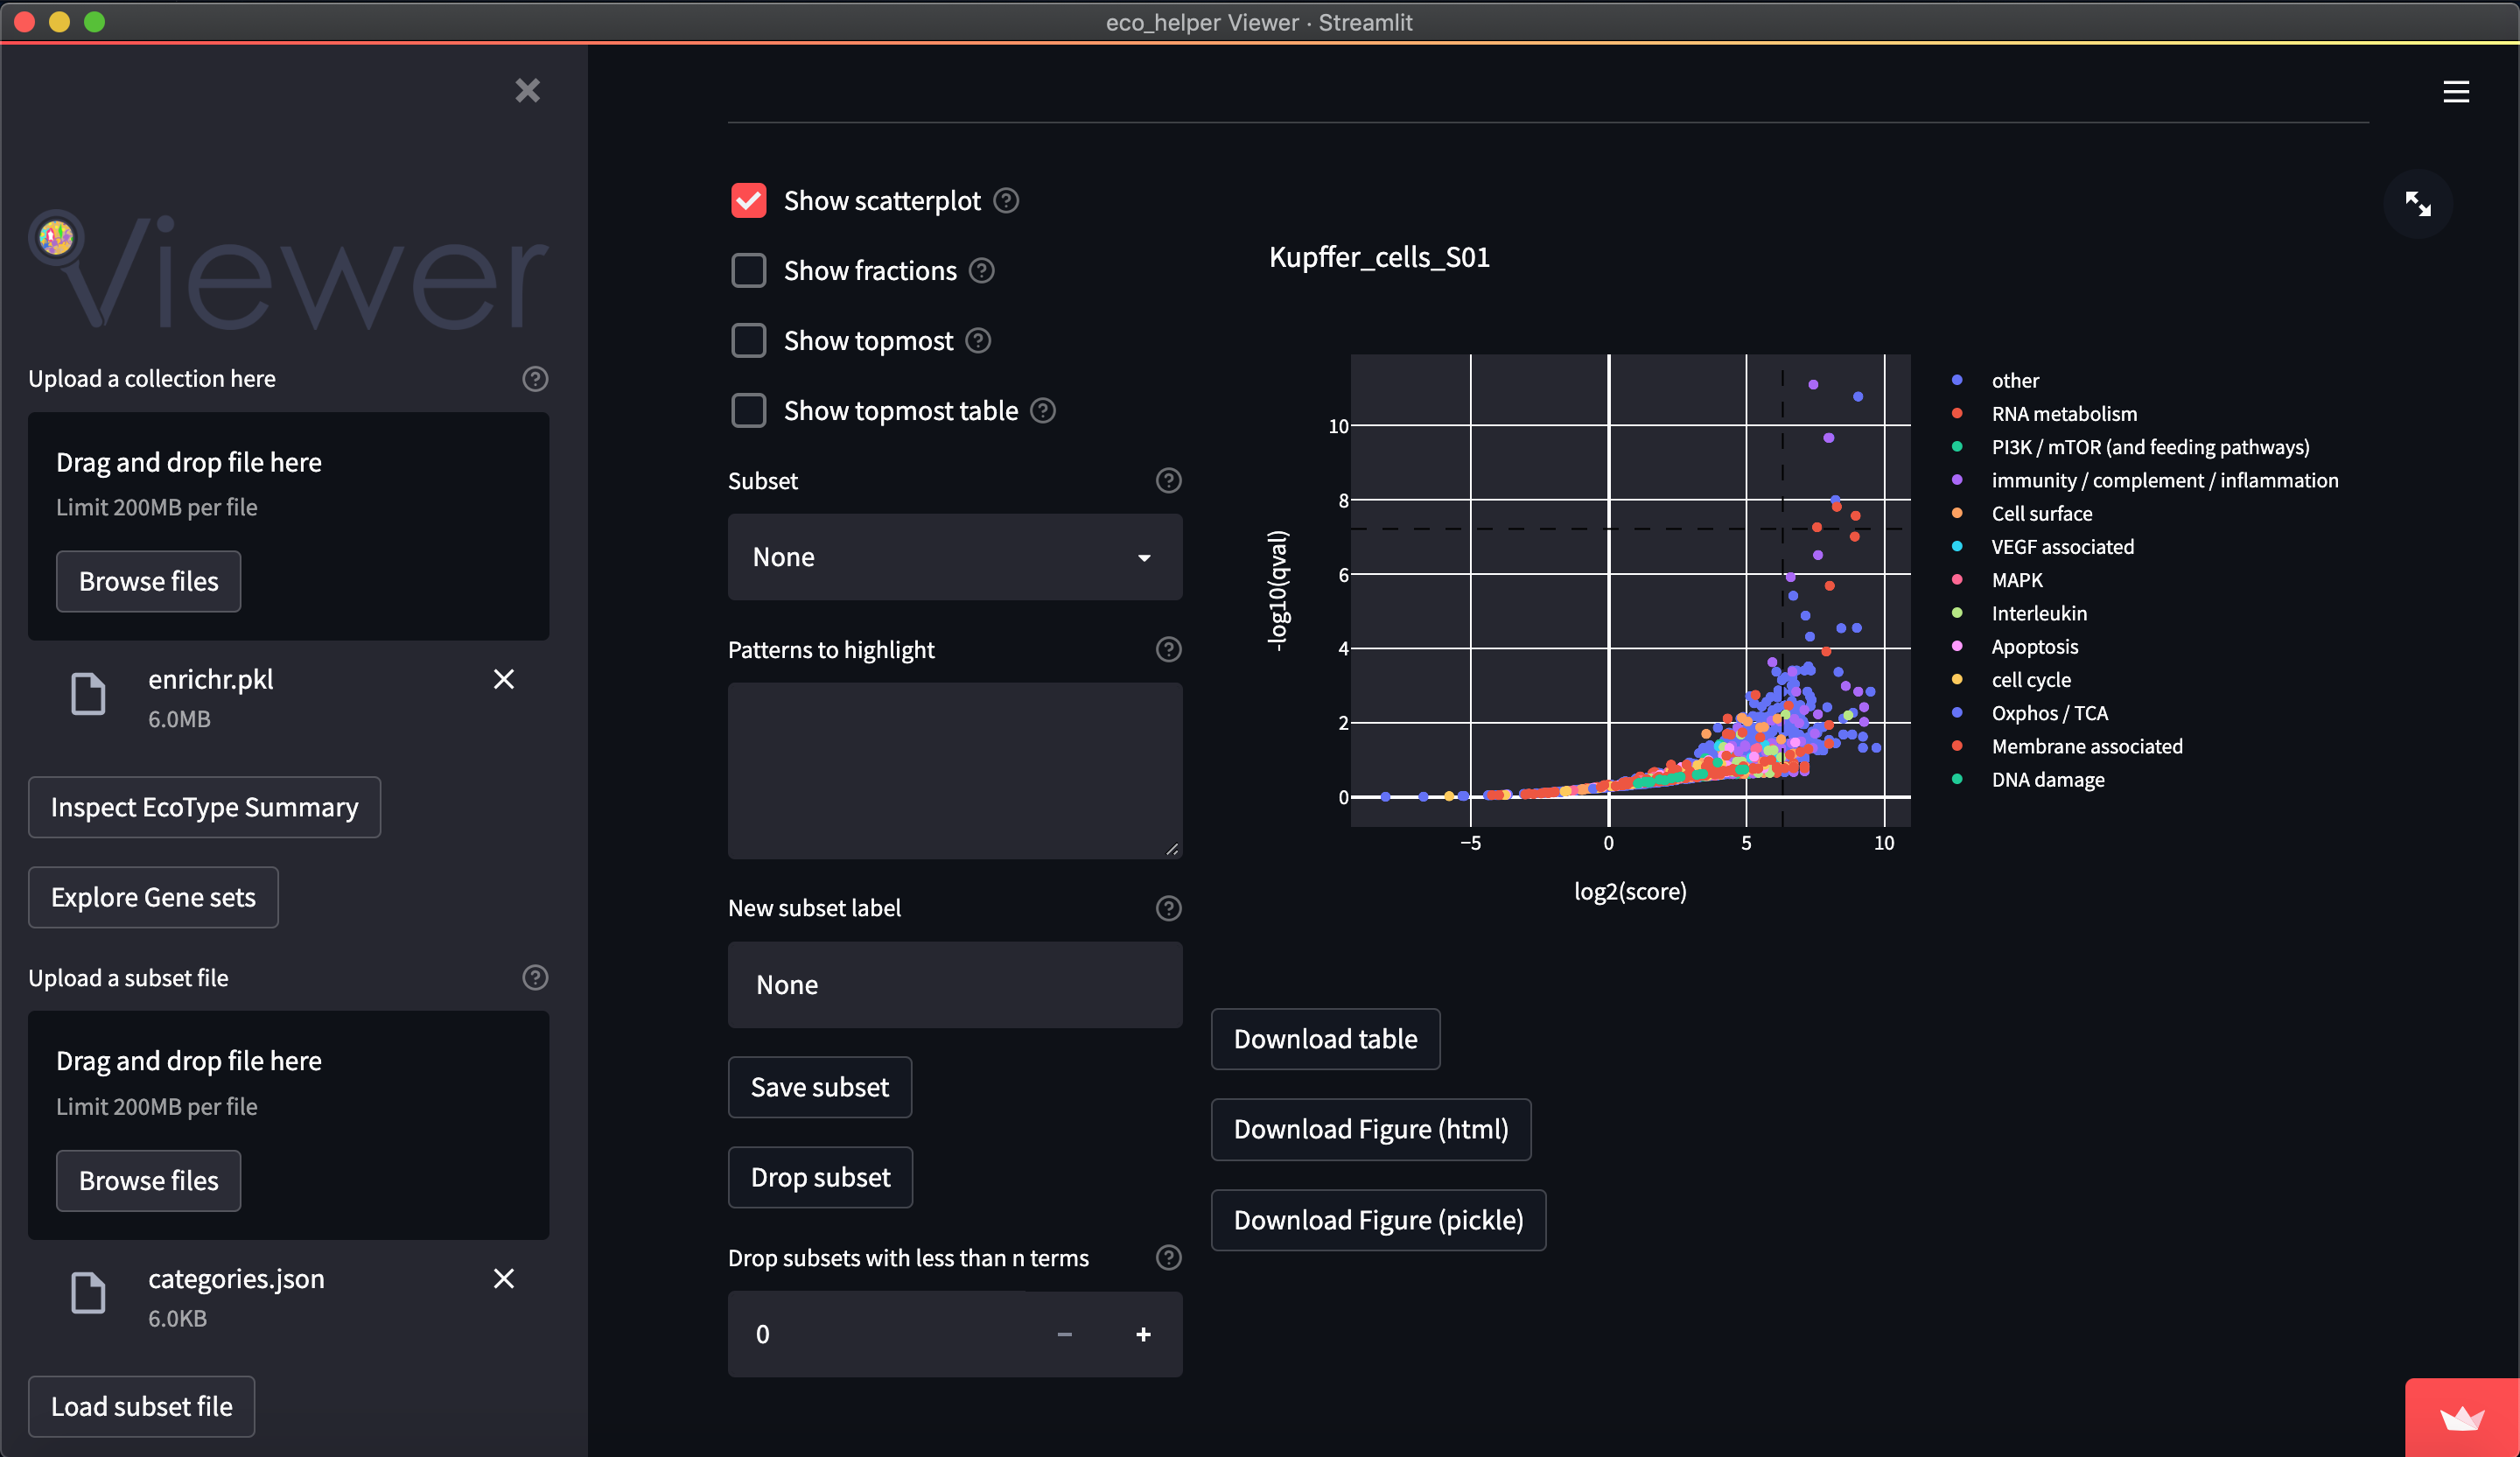
This is the web-viewer provided by eco_helper to inspect gene set enrichment results from EcoTyper analyses.
The web-viewer is hosted on streamlit and can be directly accessed here or via the badge above.
Alternatively the web-viewer can be run locally by first cloning this repository, creating an environment with the necessary dependencies, and then running
streamlit run src/main.pyfrom the repository root directory. By default the web-viewer is then available at localhost:8501.
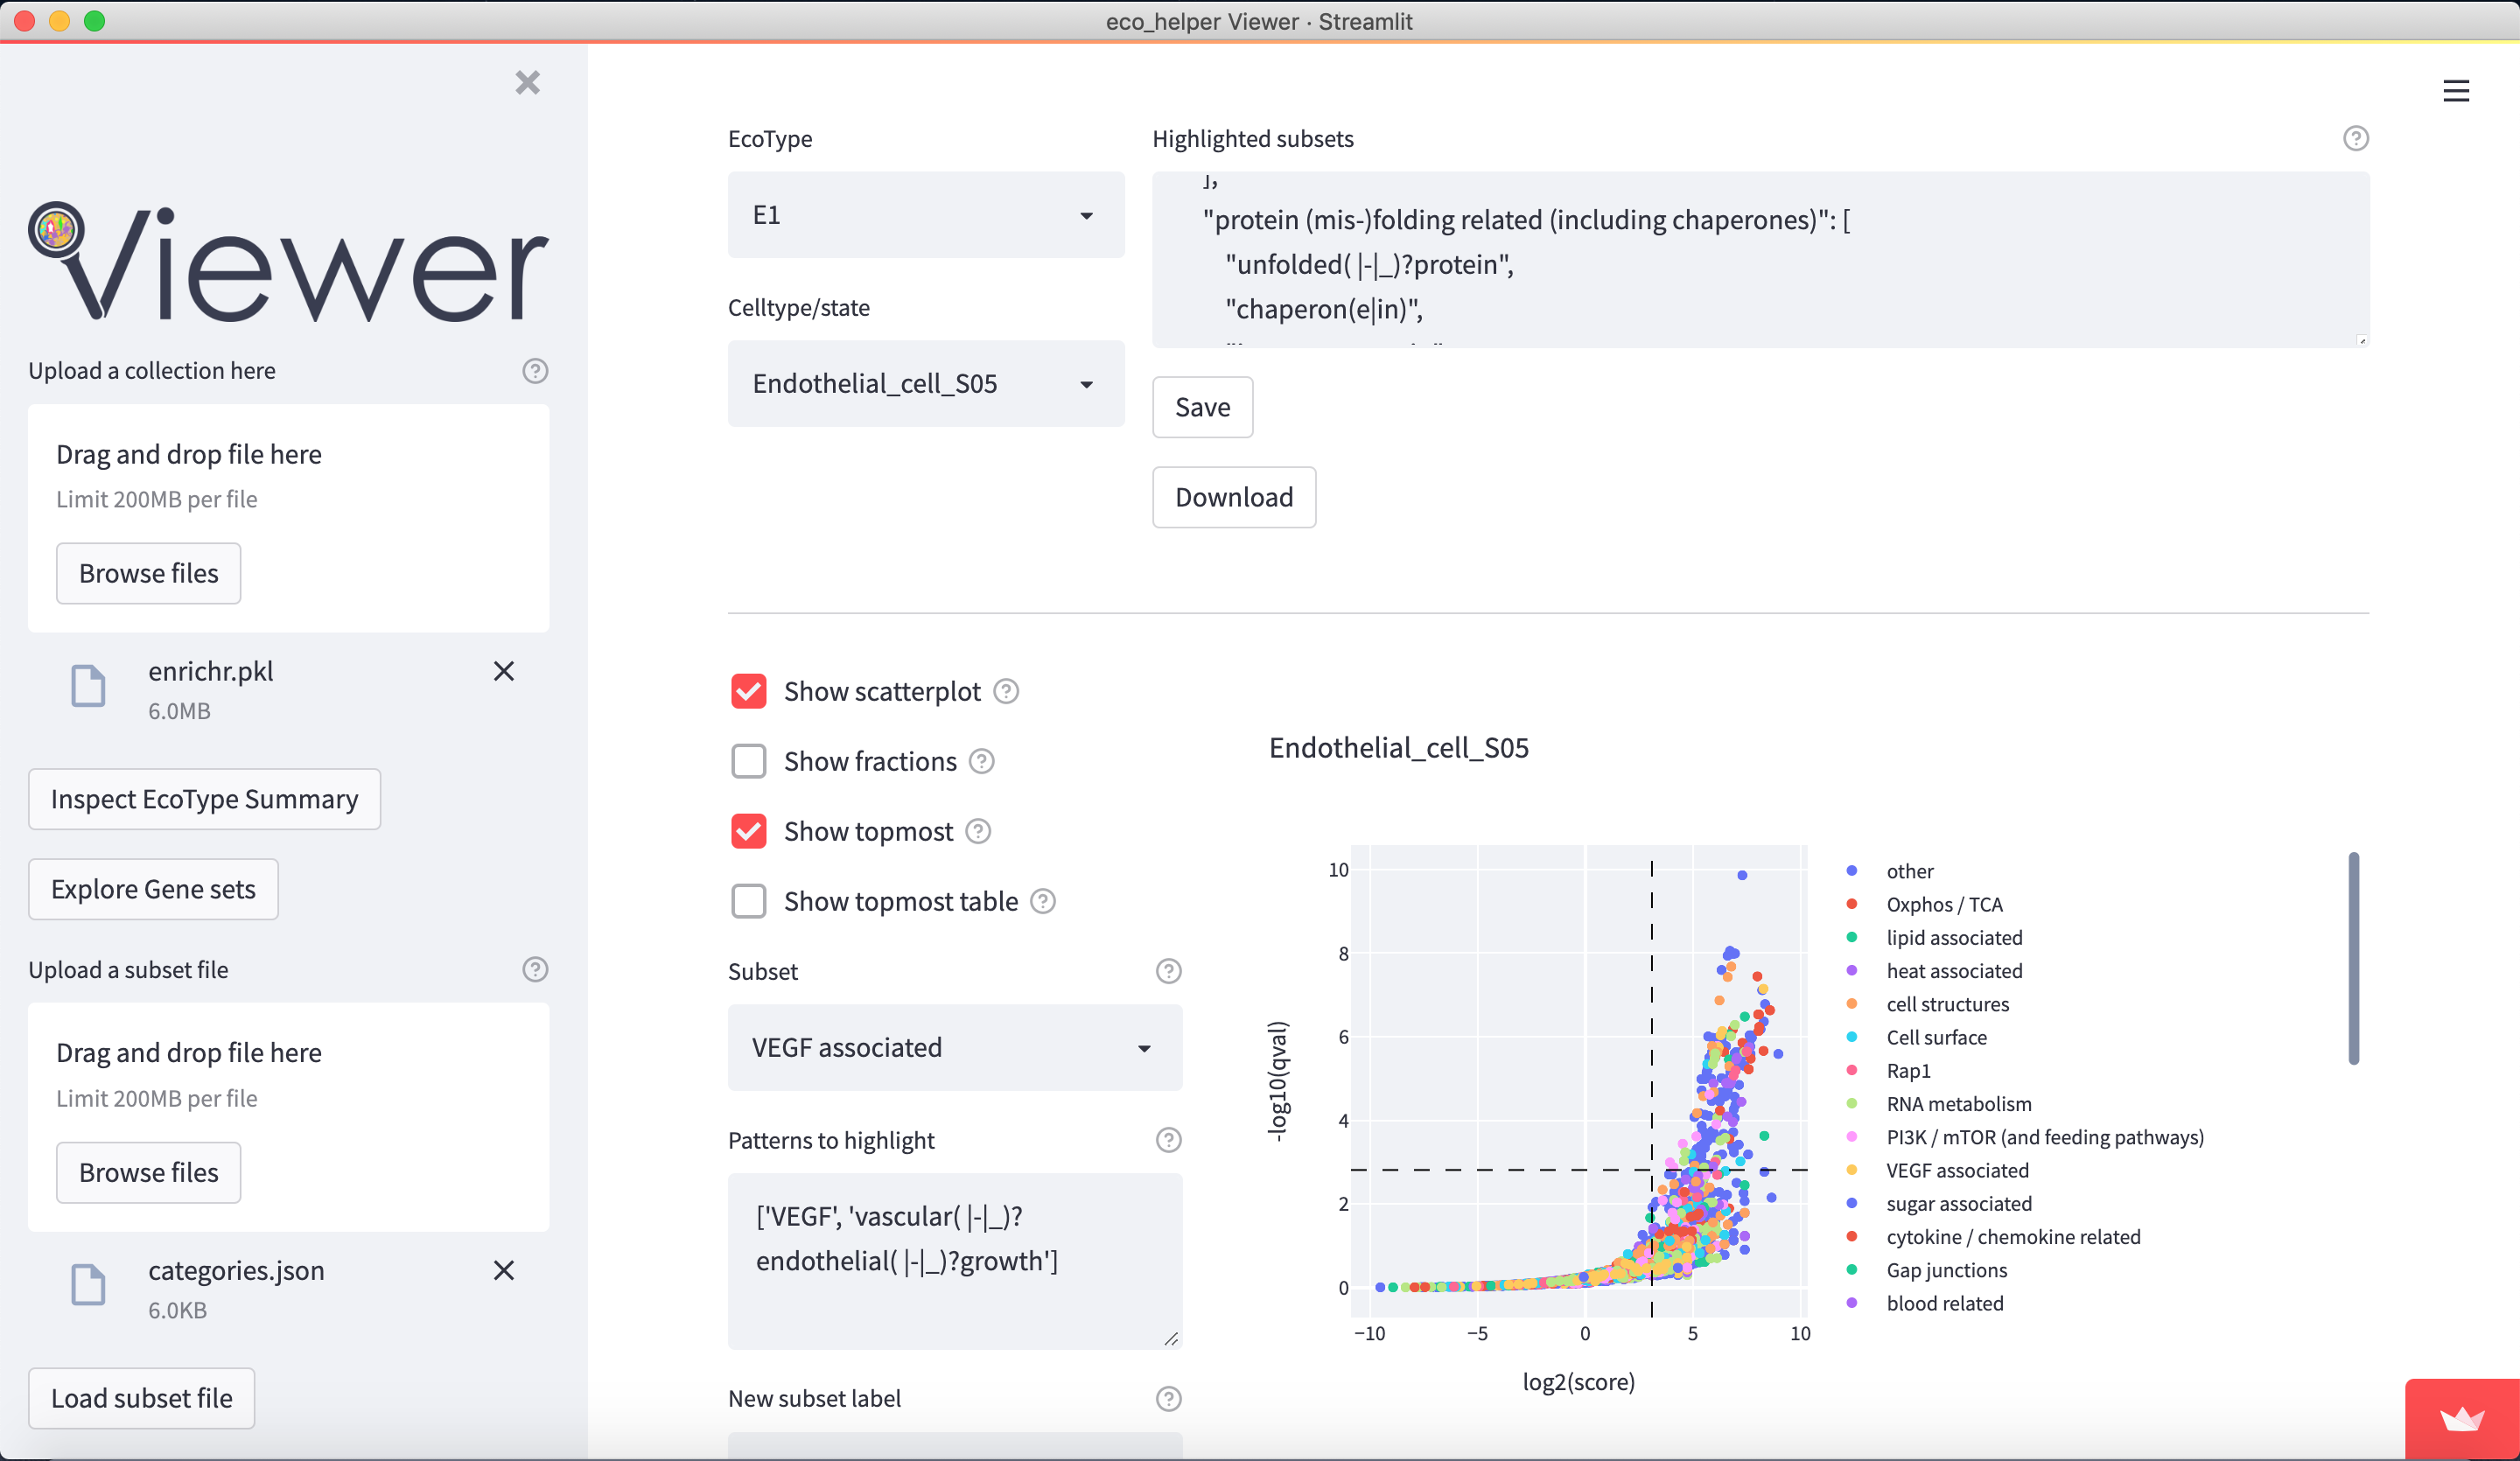
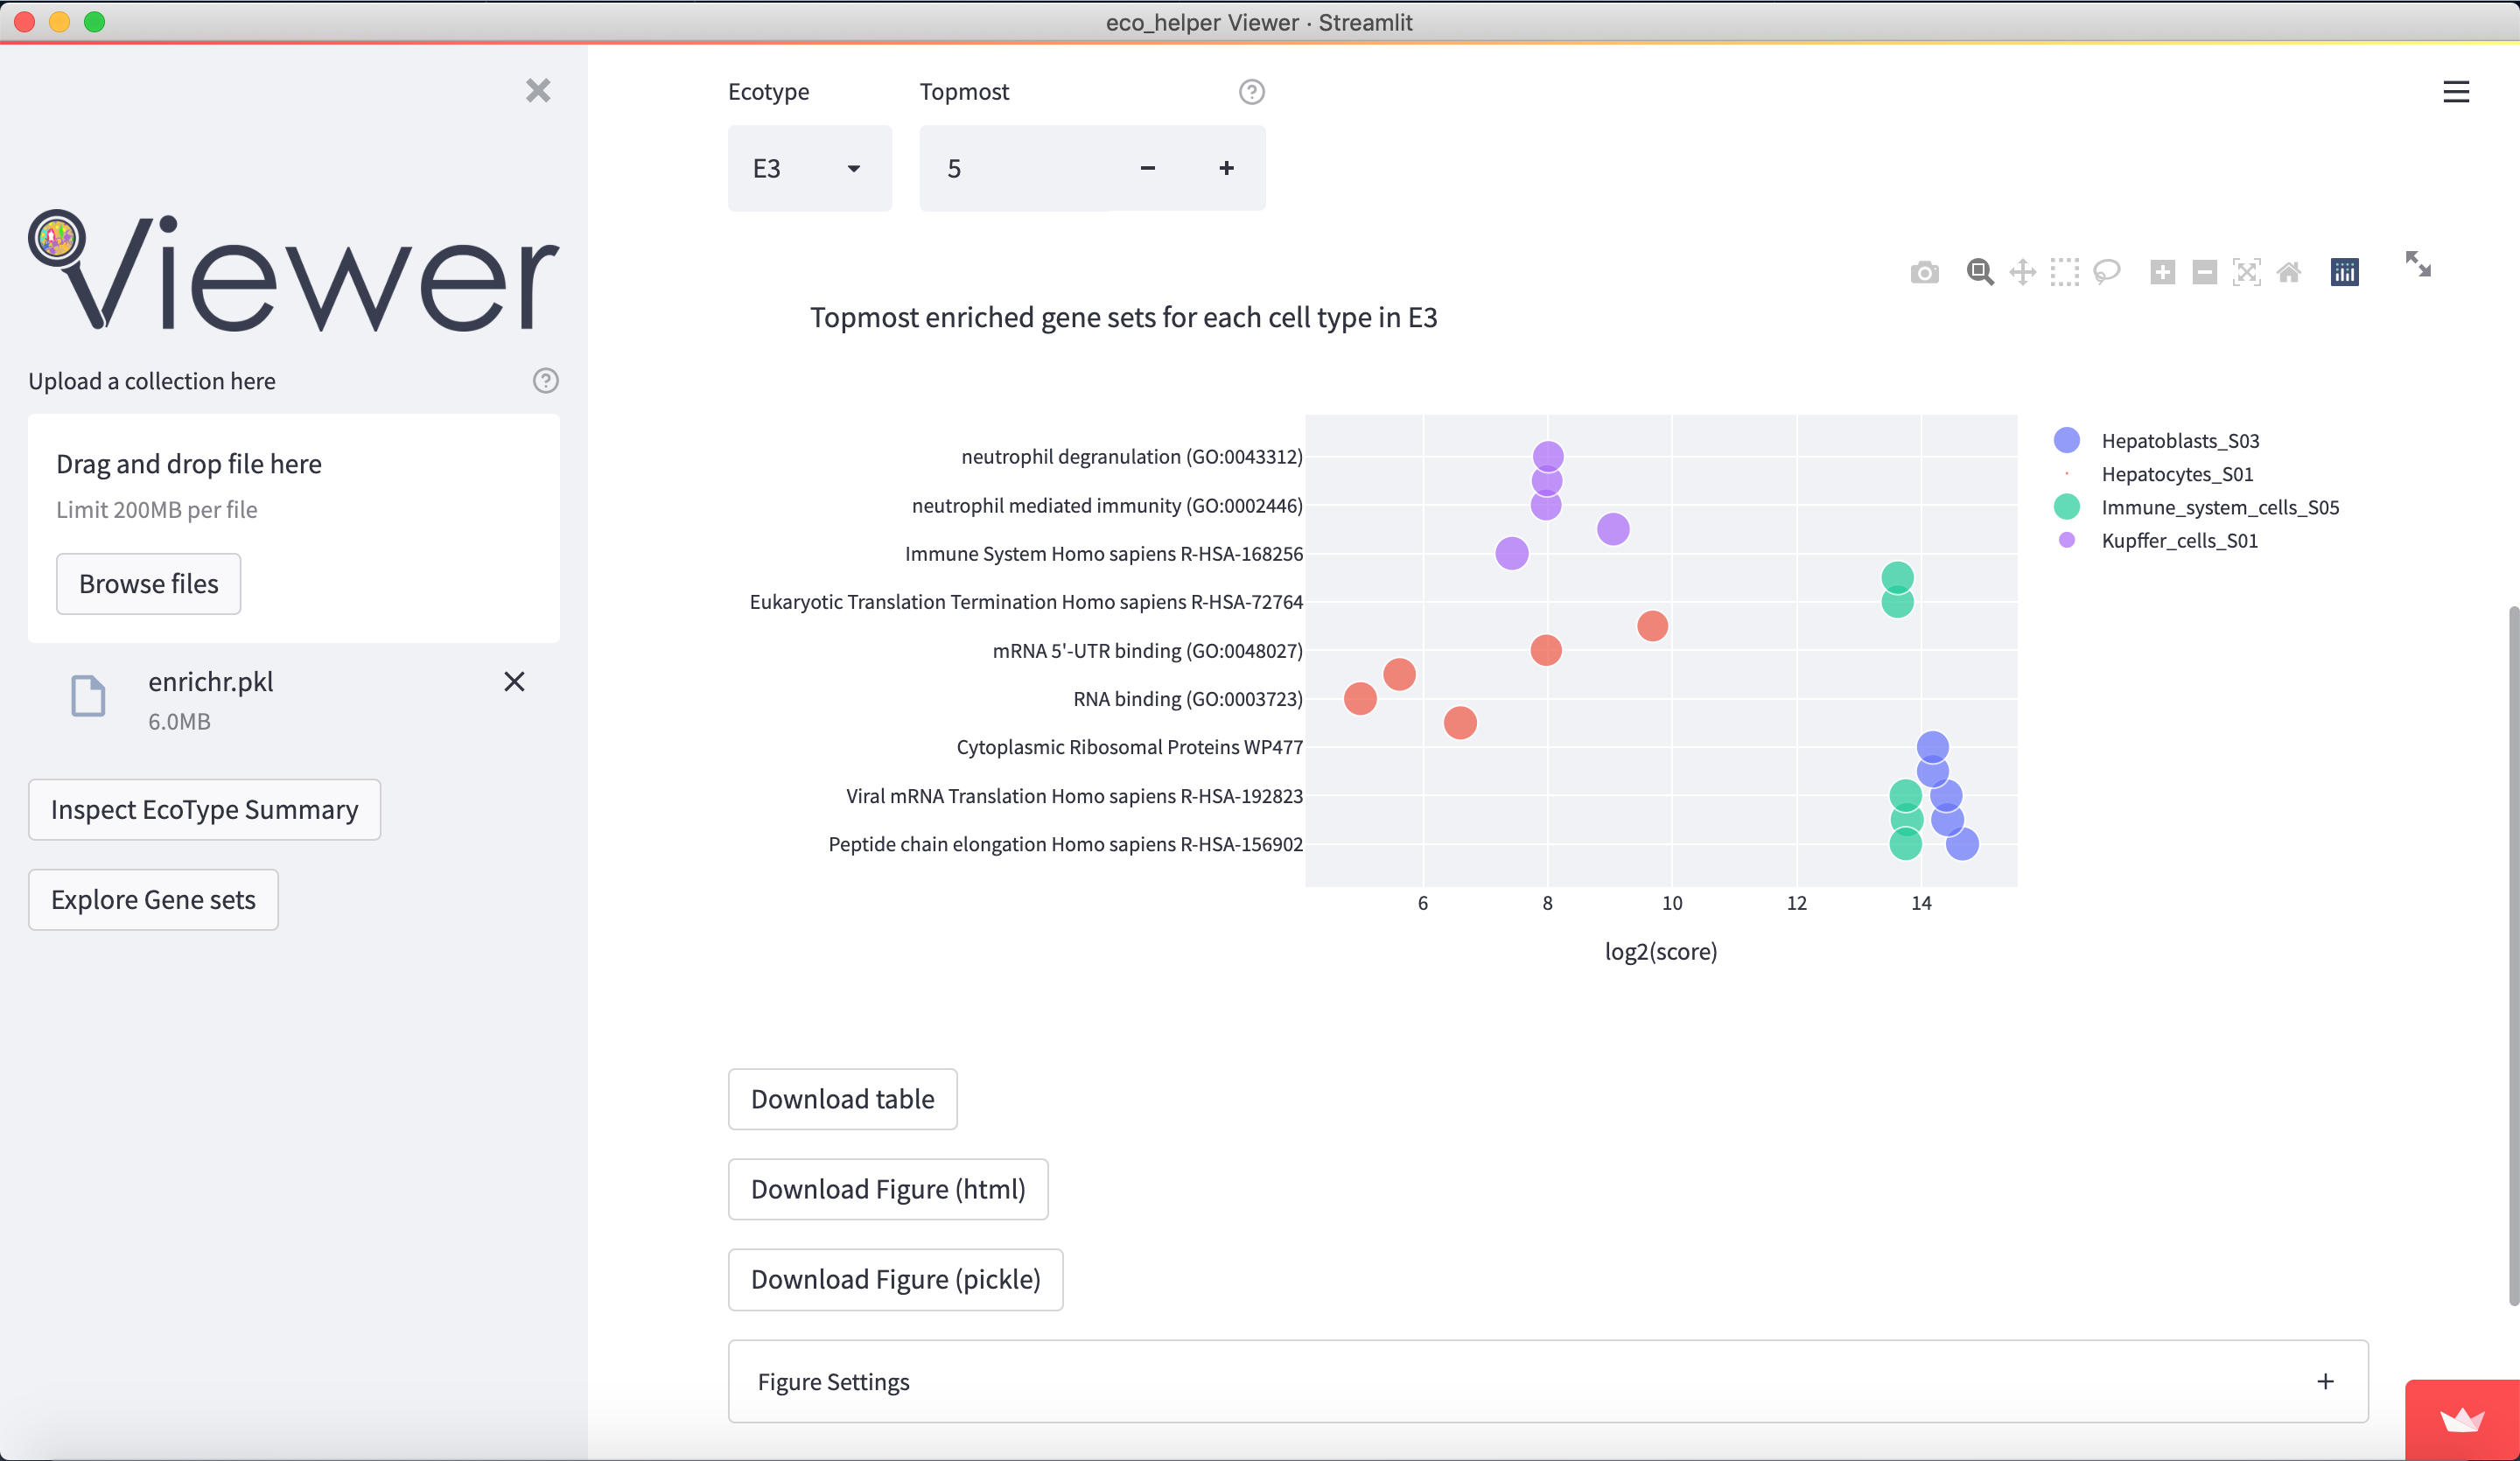
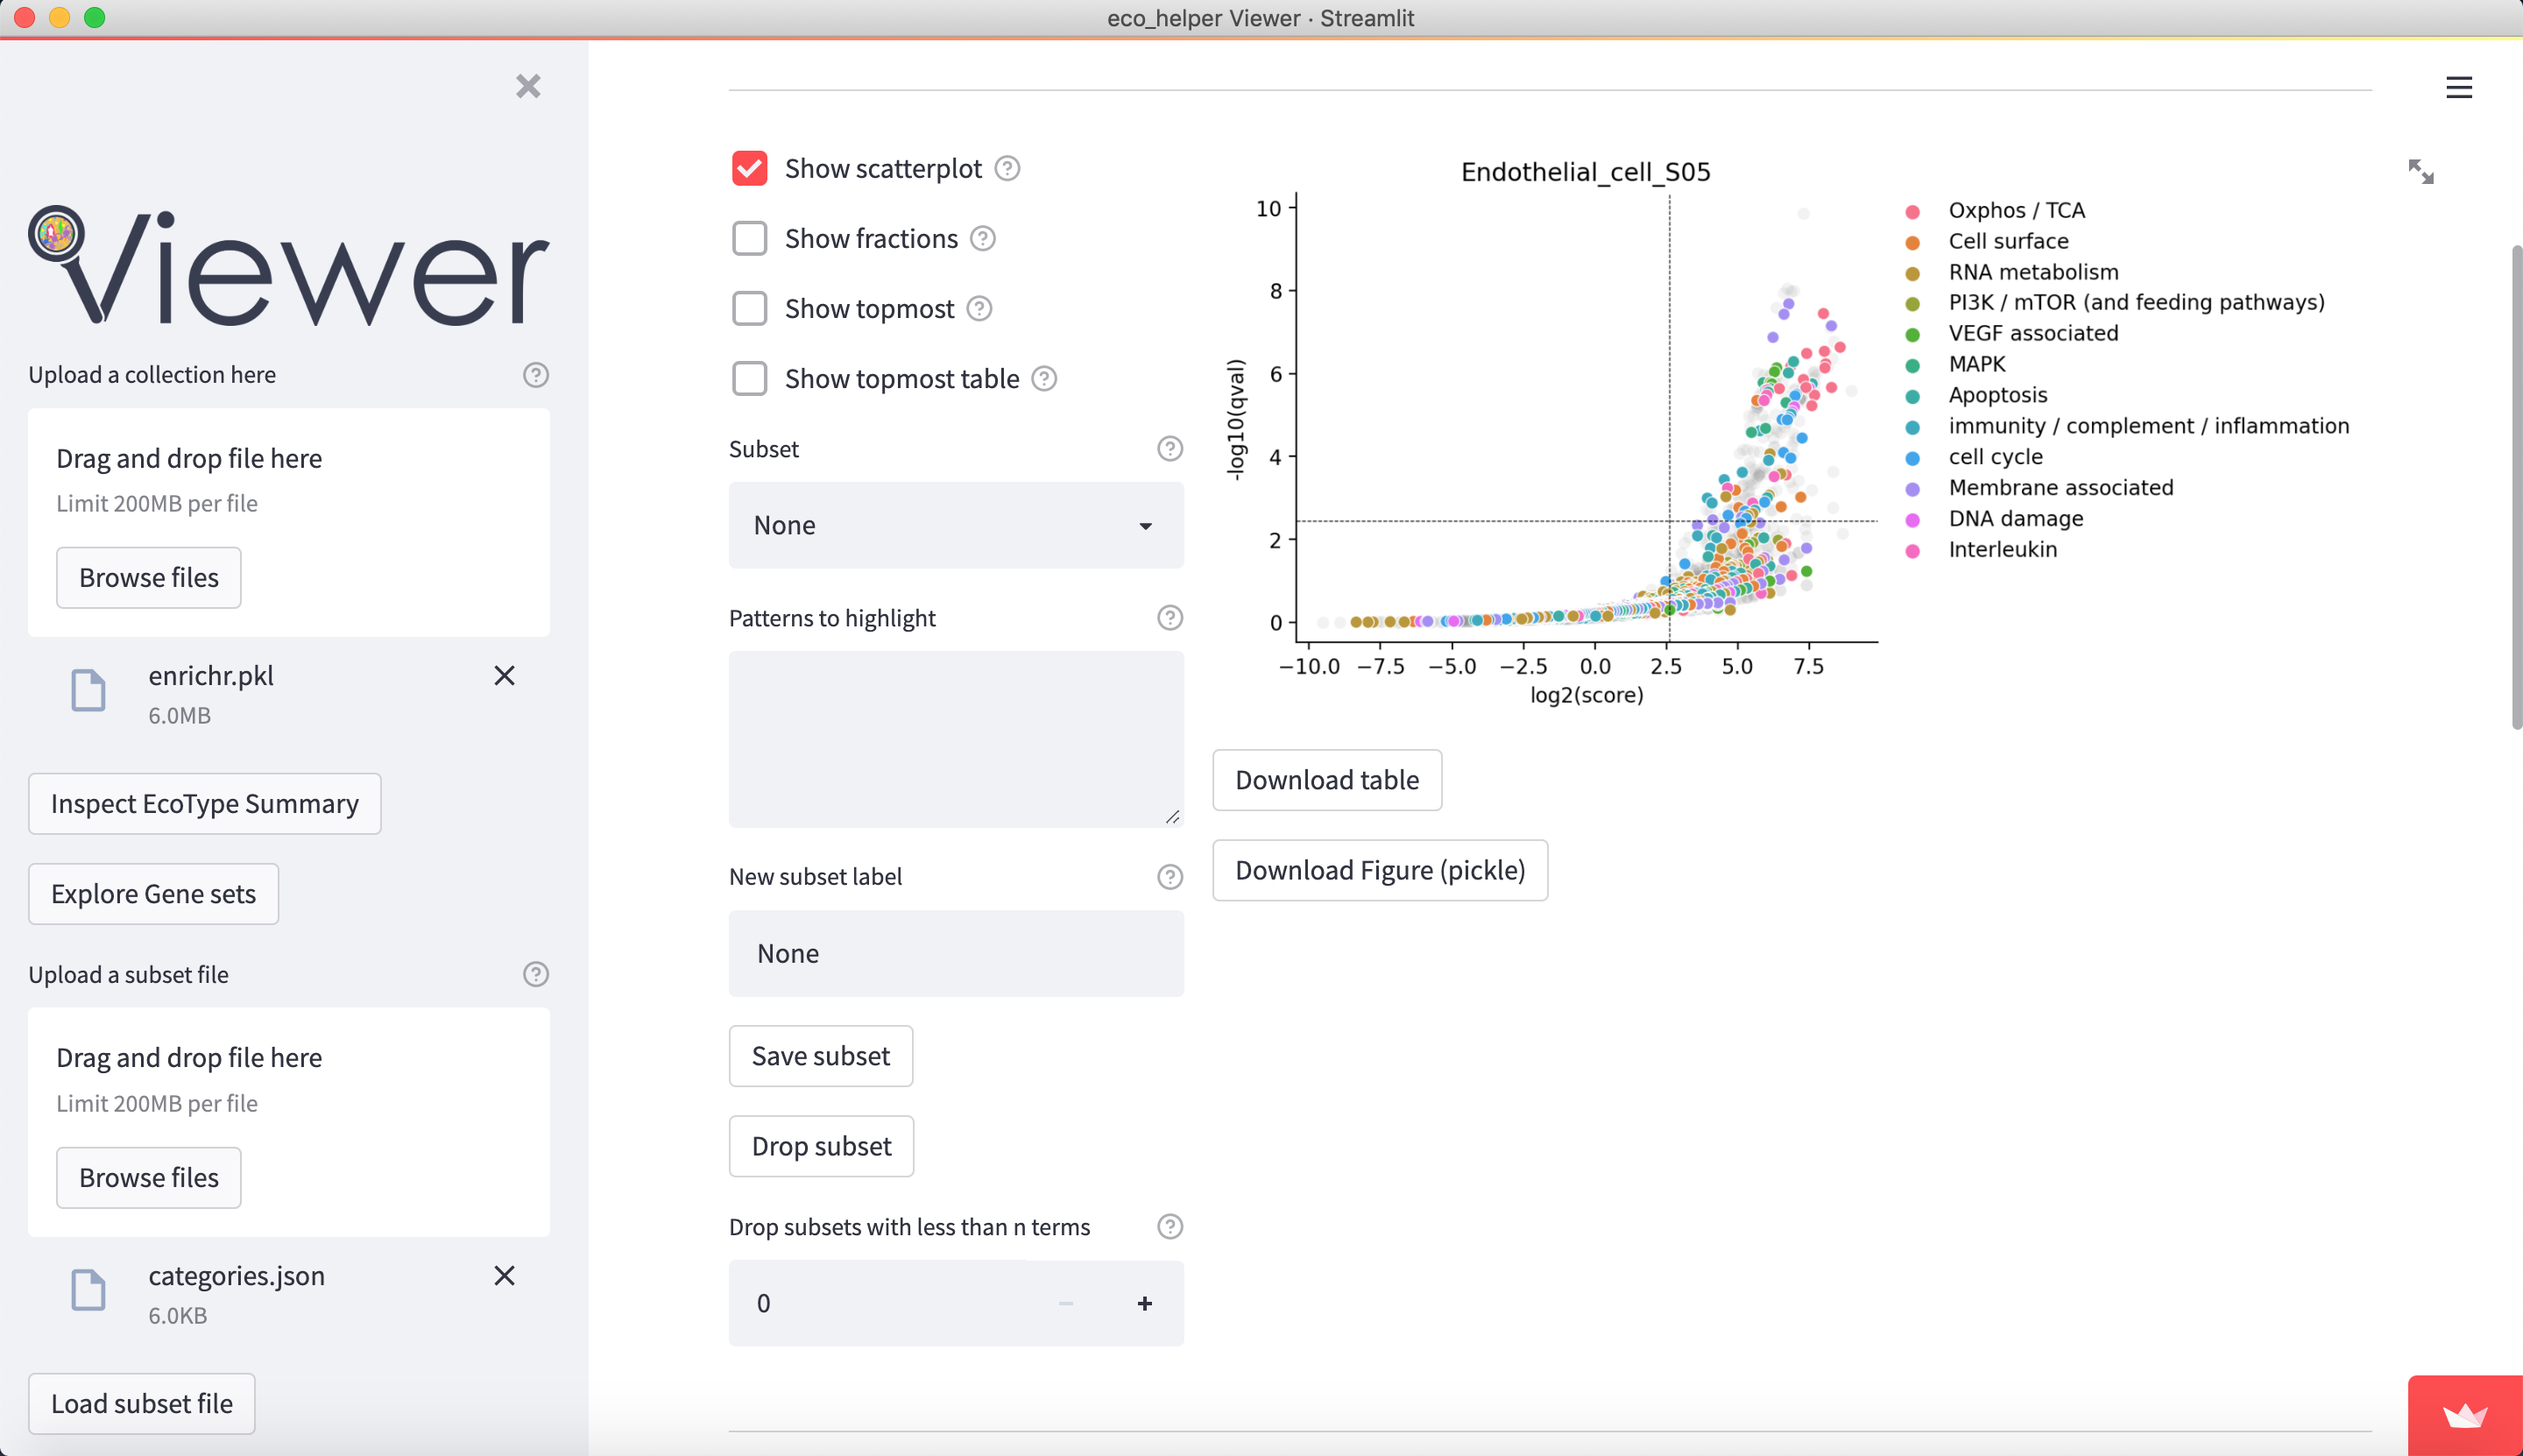
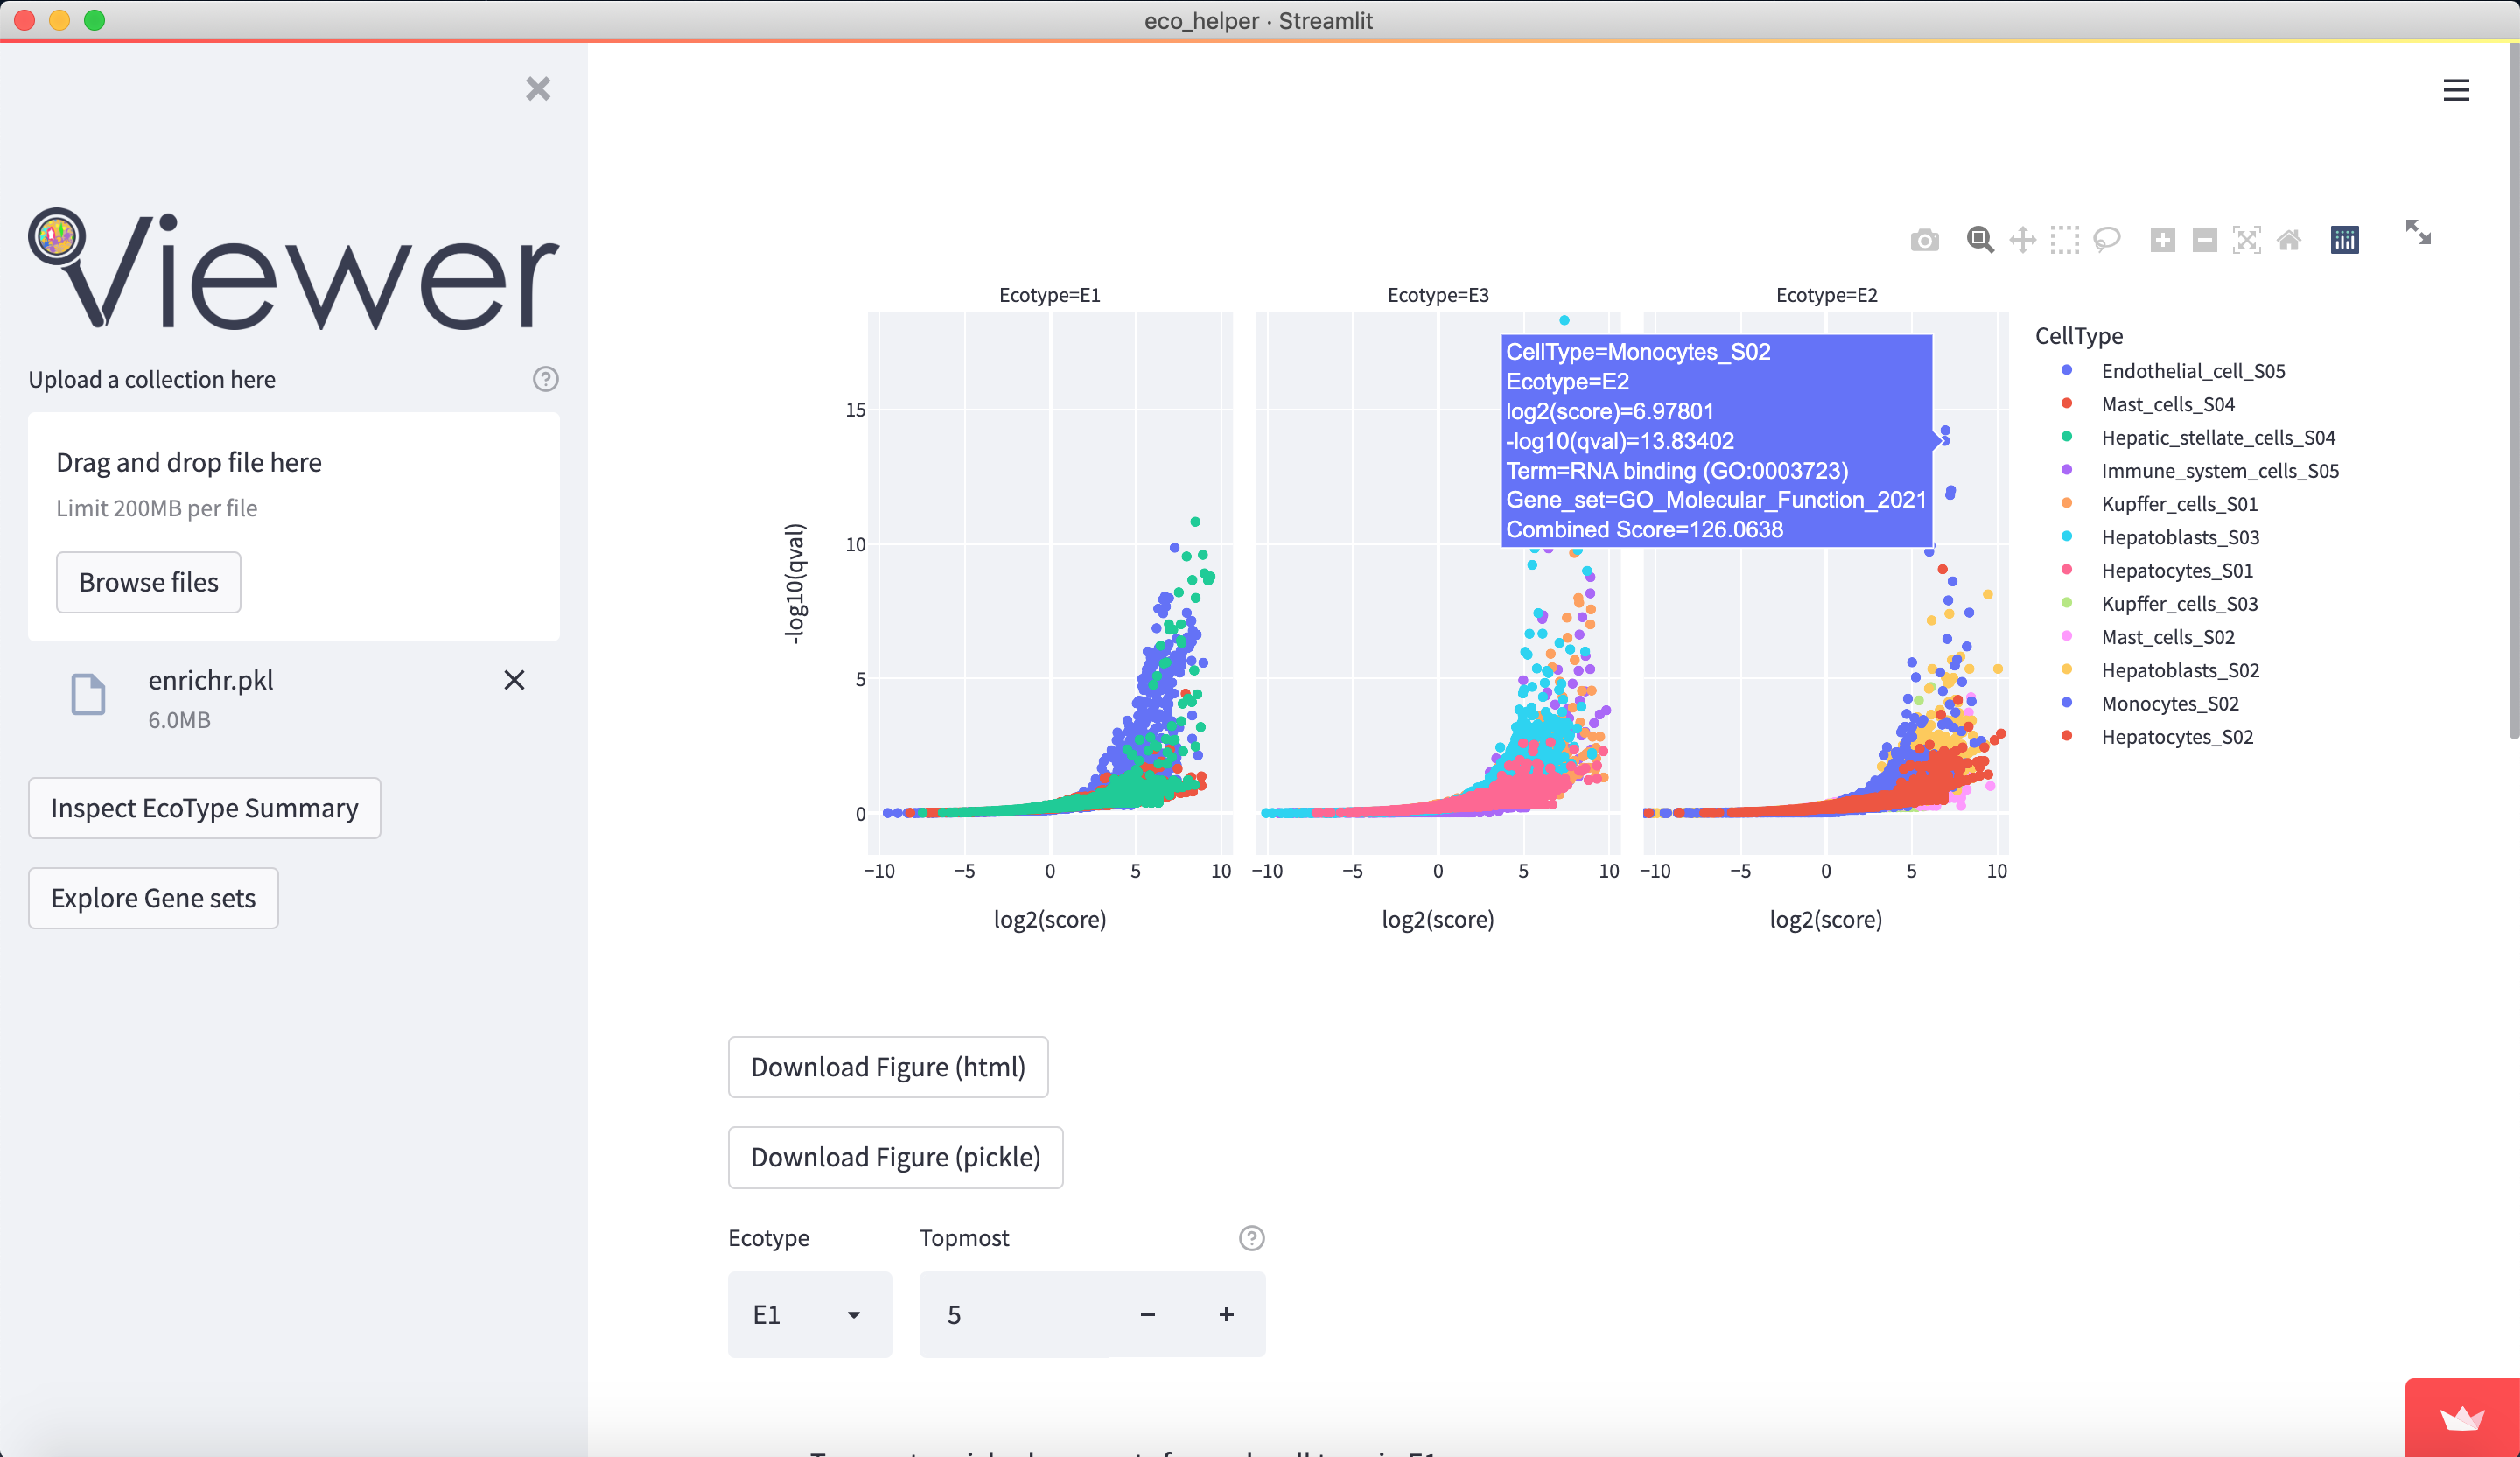
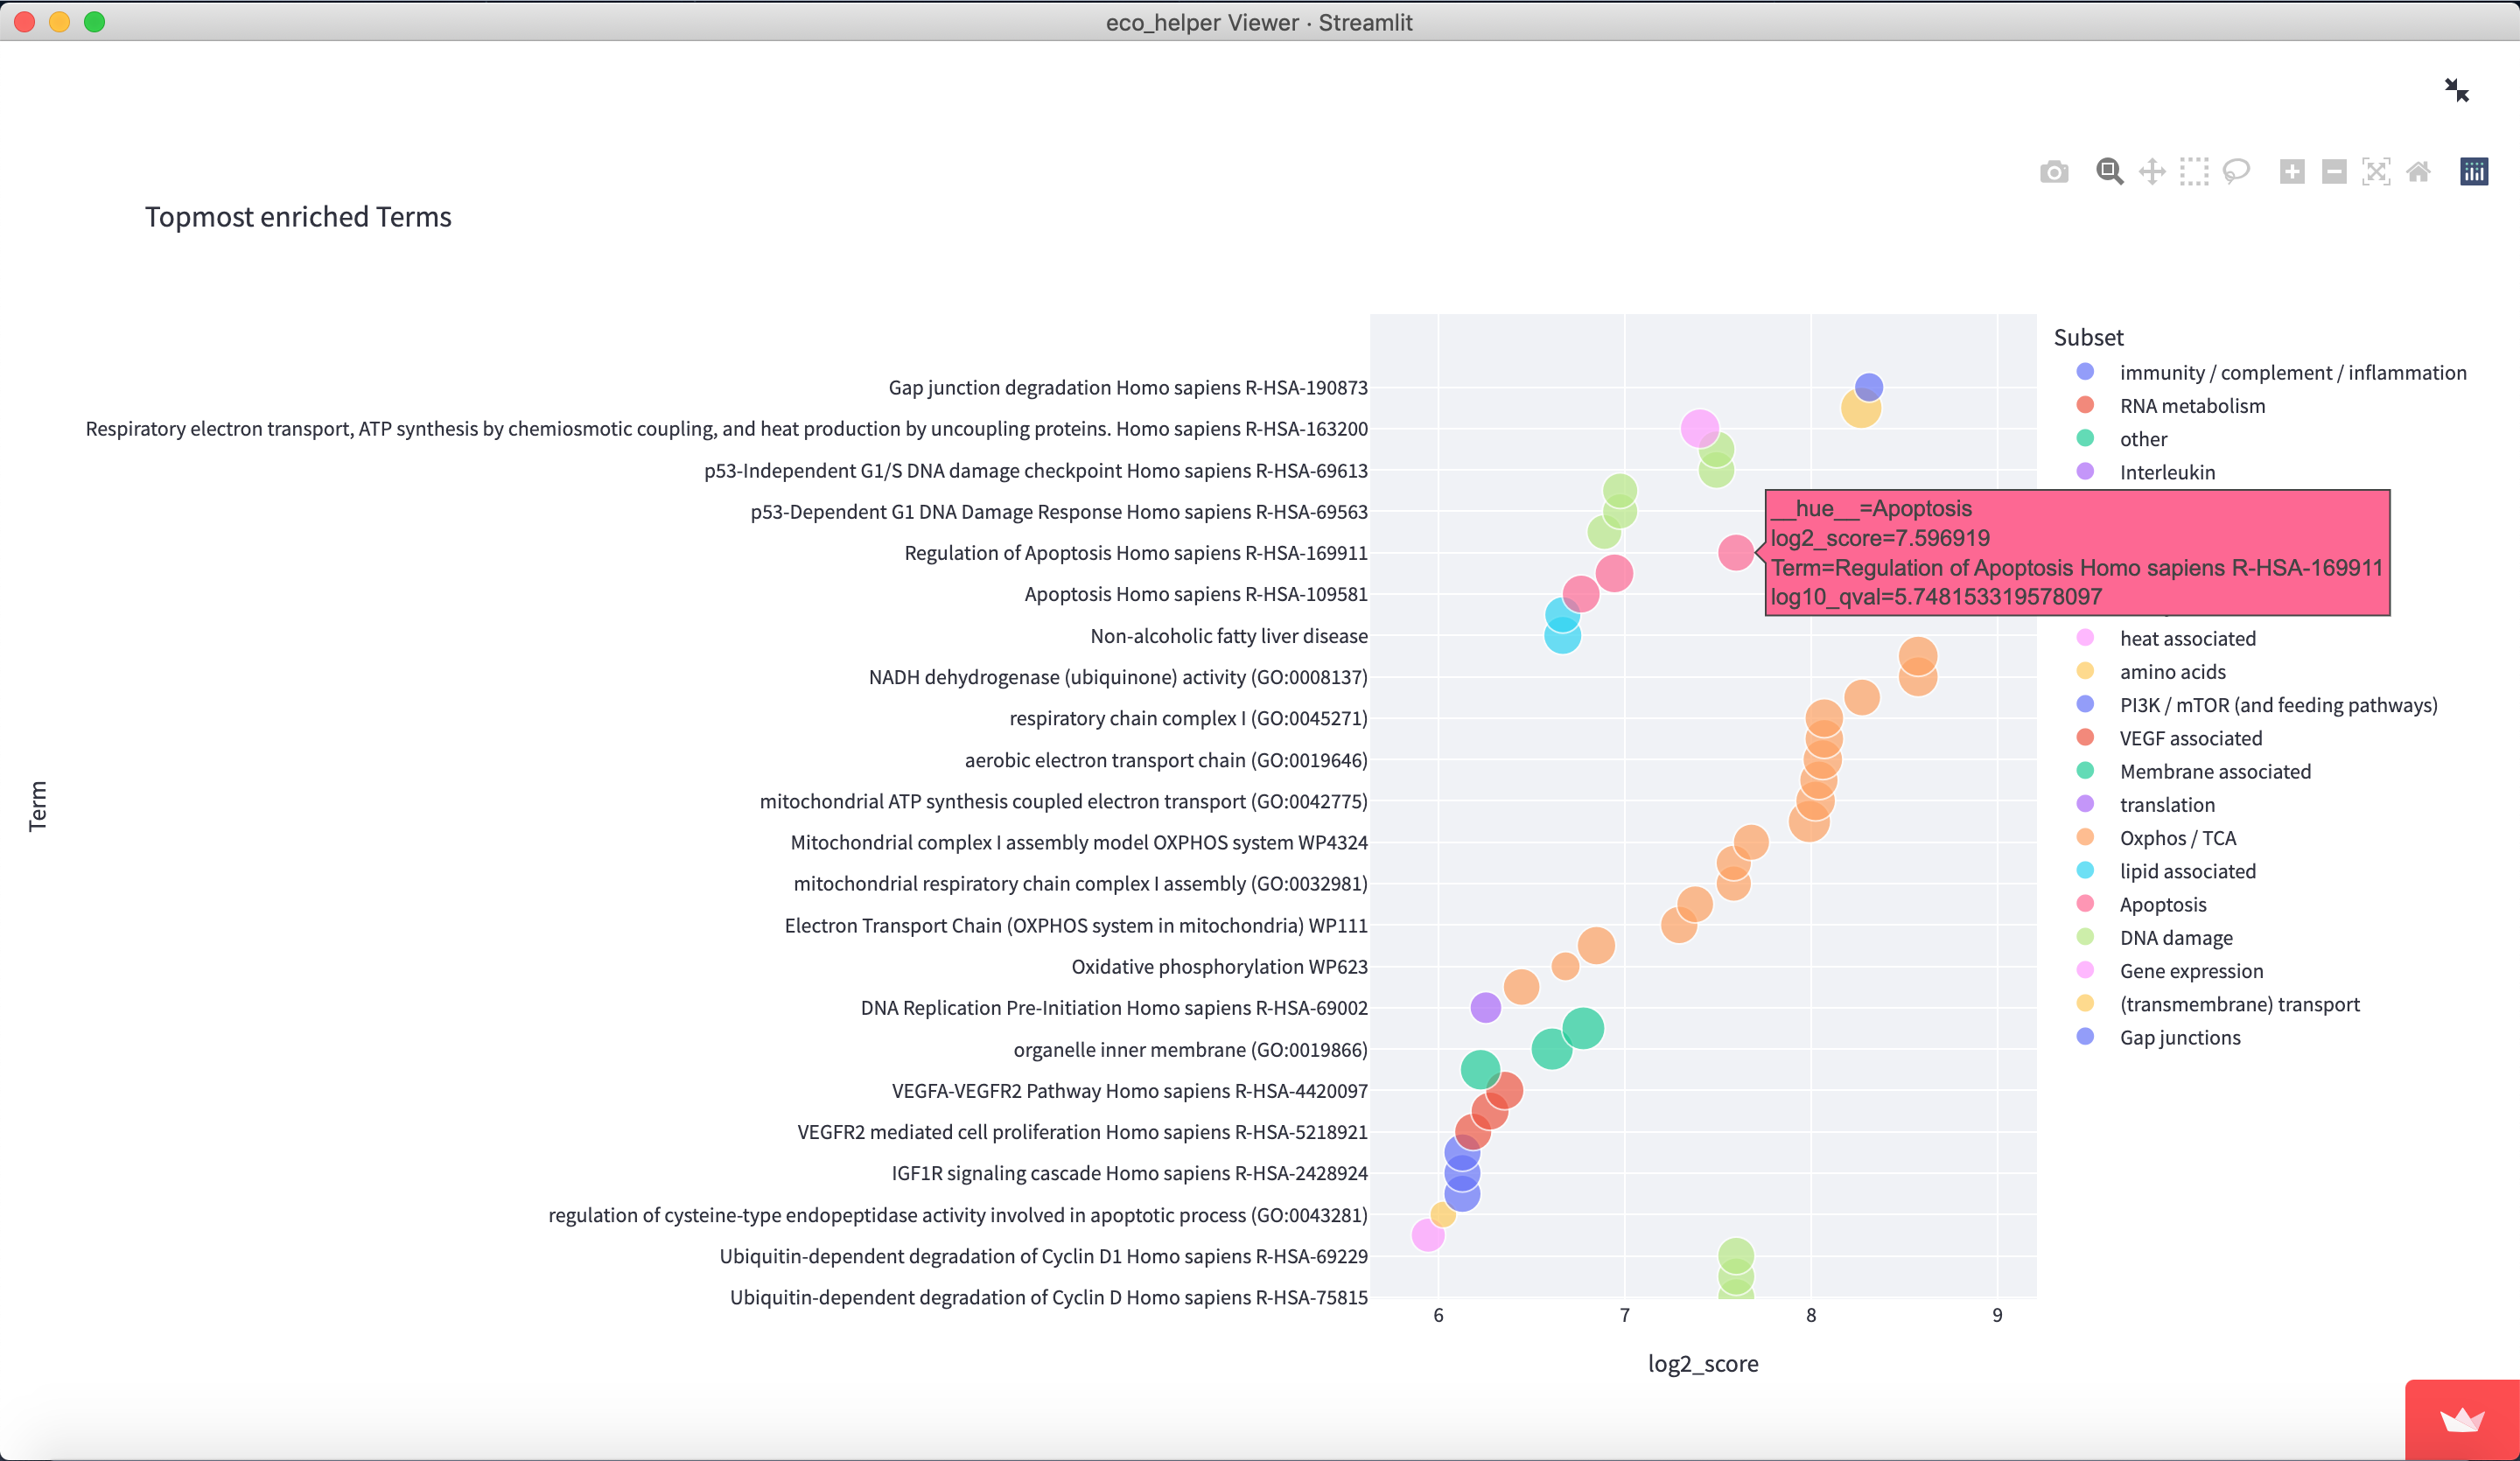
The web-viewer allows an interactive overview of the enriched gene-sets in each celltype/state in each EcoType. It visualises volcano-plots and bubble plots of topmost enriched gene-sets. It allows highlighting of gene-set subsets through regex-pattern to better understand the behaviour of a particular celltype/state in a given EcoType - e.g. highlight terms associated with apoptosis through (python-style) regex-patterns such as ["apopto(sis|tic)( |-)(regulation)?", "cell( |-)death"]. There are dedicated input fields for adding/editing such subsets and a python dictionary of pre-existing patterns can be loaded.
Figures are available both interactively through plotly and statically through matplotlib. Figures can be downloaded in html (plotly), png (both), and as pickle files (both) which contains the respective python figure object directly, so the user may later edit the figures to their liking.
The web-viewer requires a pickle file as input. This should store a single eco_helper.EnrichmentCollection object. This can be easily generated by the eco_helper enrich command using the --pickle option.
However, in case your data was not generated with the help of eco_helper, a dictionary of pandas.DataFrames should also work as well. The keys are the designated Ecotype labels and the values (pandas dataframes) summarize all the celltypes/states and their enriched gene sets associated with the EcoType.
For the app to work properly the dataframes must contain at least the following columns (named exactly like this):
CellType(celltype/state annotation)Term(enriched gene-set label)log2_score(enrichment score log2-transformed)log10_qval(adj. p-value log10-transformed)
The dataframes can contain any additional columns and the columns used for plotting can be changed in the app later.


