Warning: This repository is under heavy development and the content is not final yet.
MEGA is a deep learning-based python package for identifying cancer-associated intratumoral microbes.
If you have any questions or feedback, please contact Qin Ma qin.ma@osumc.edu.
The package is also available on PyPI: https://pypi.org/project/pyMEGA/
Updated:
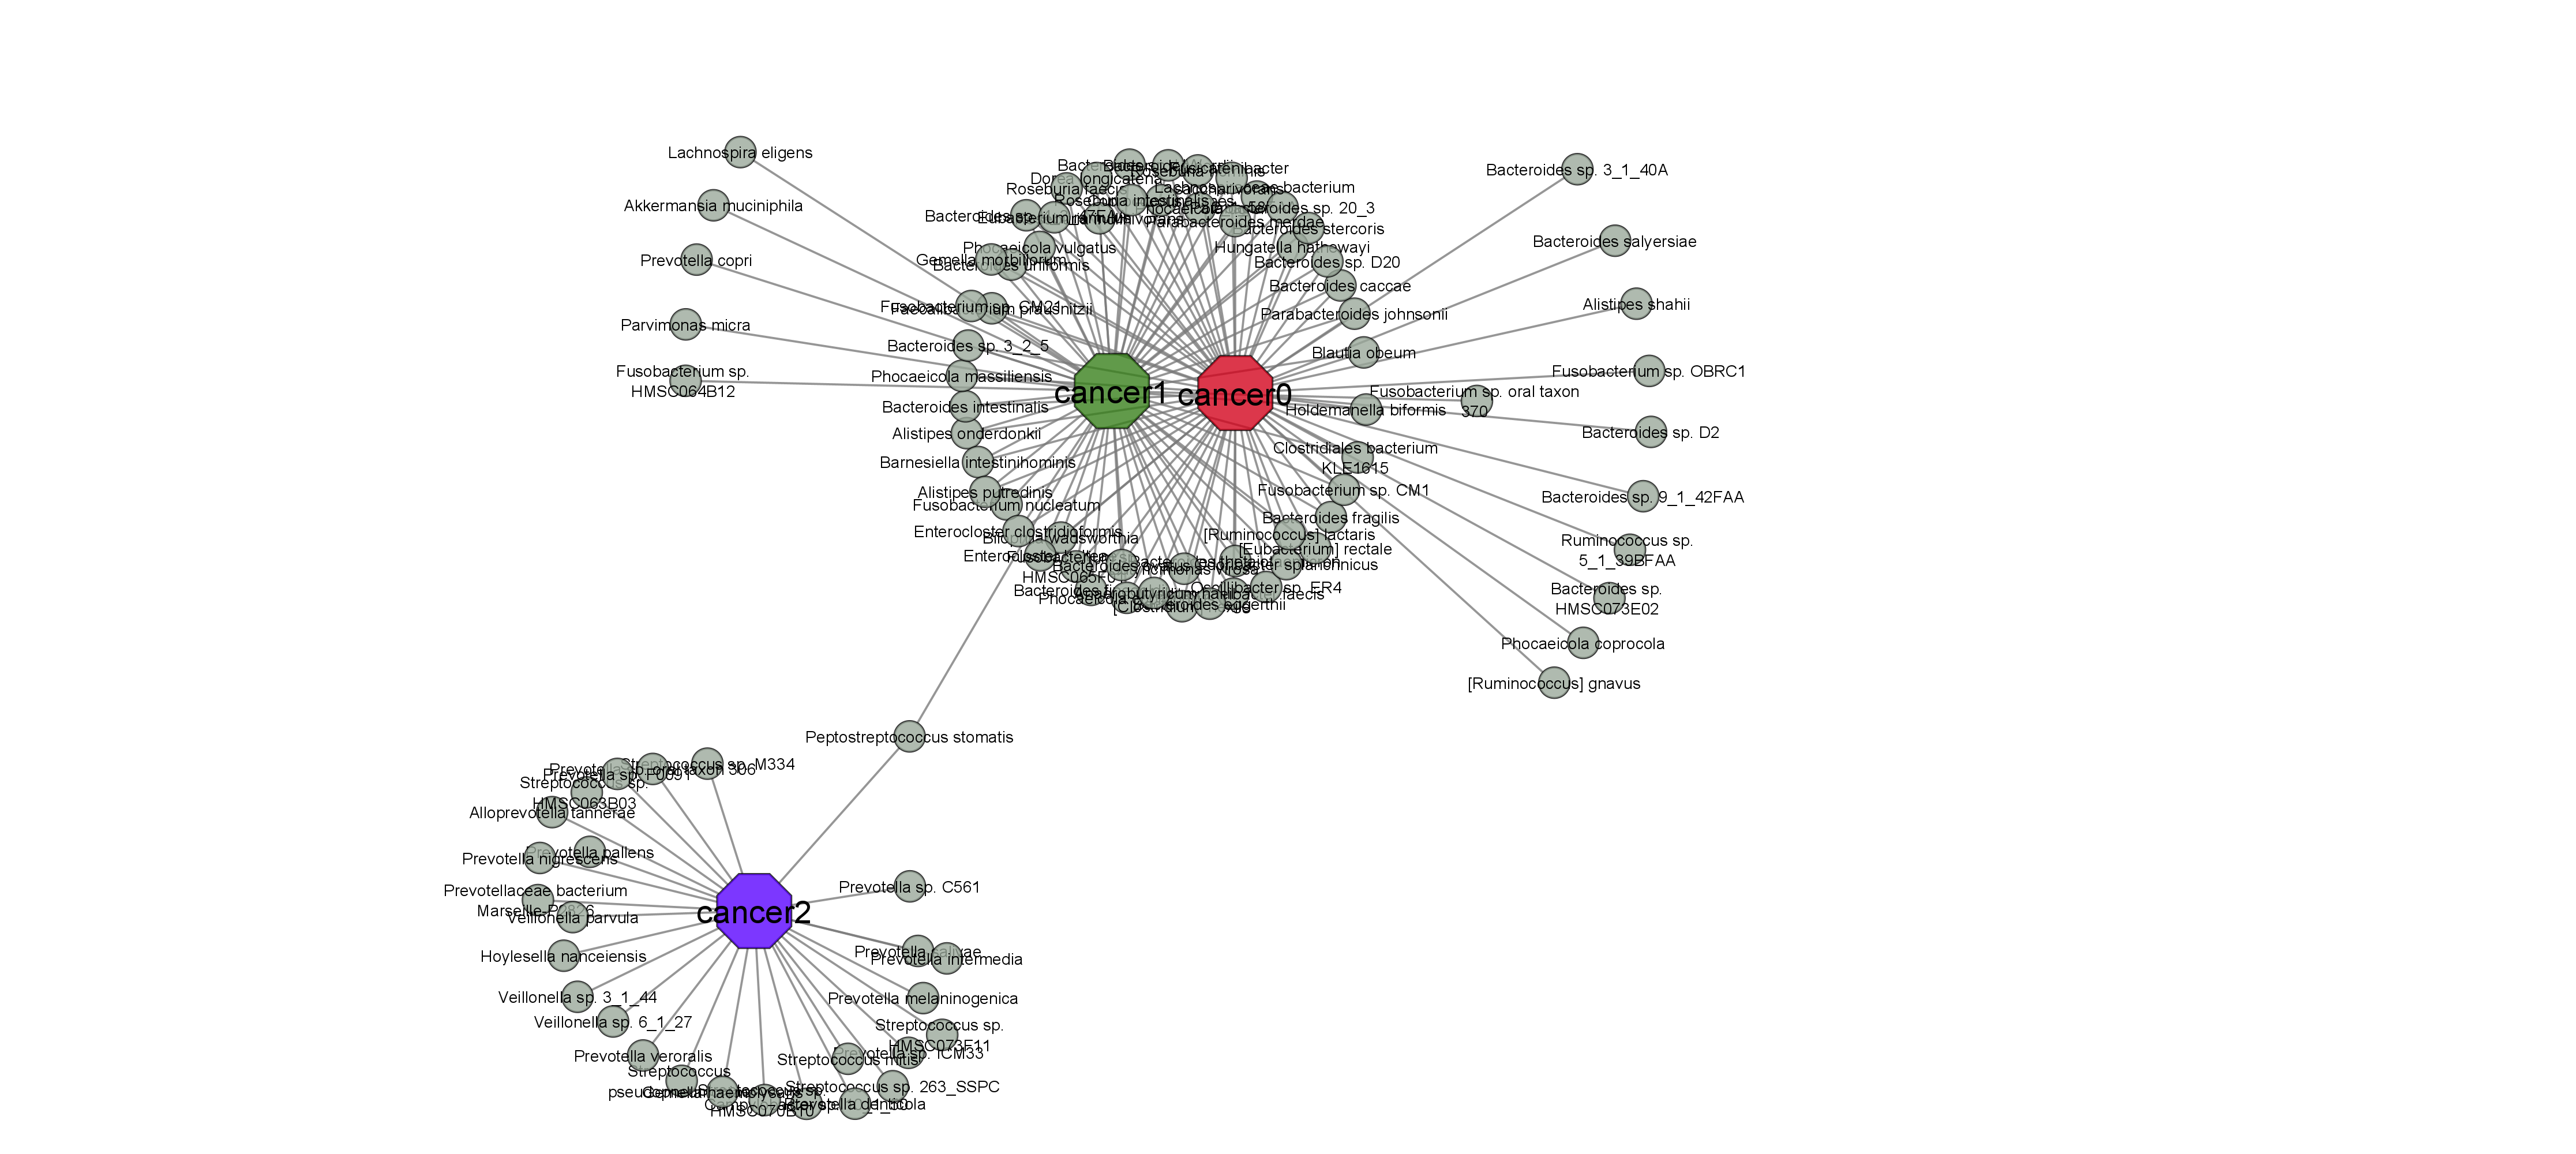
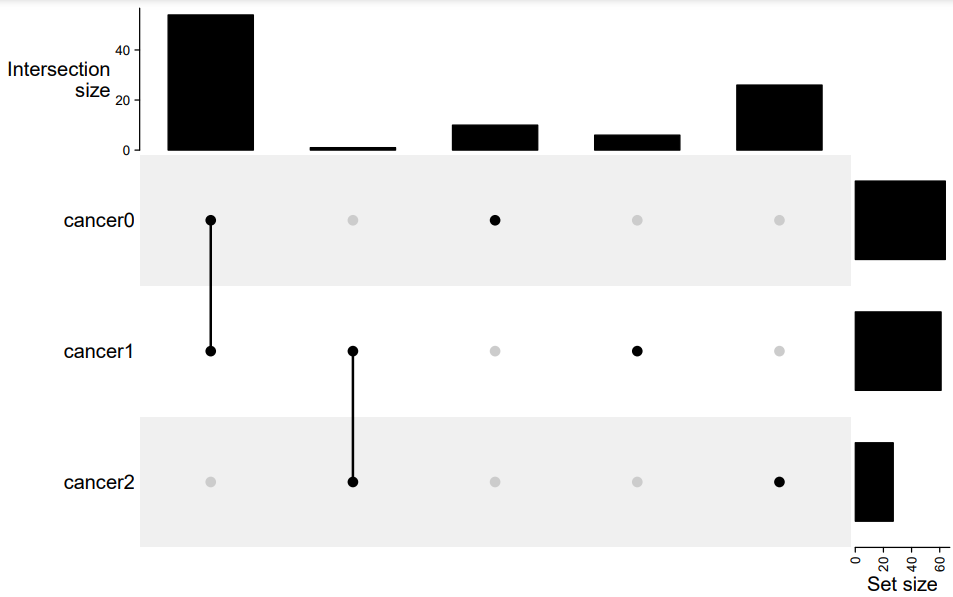
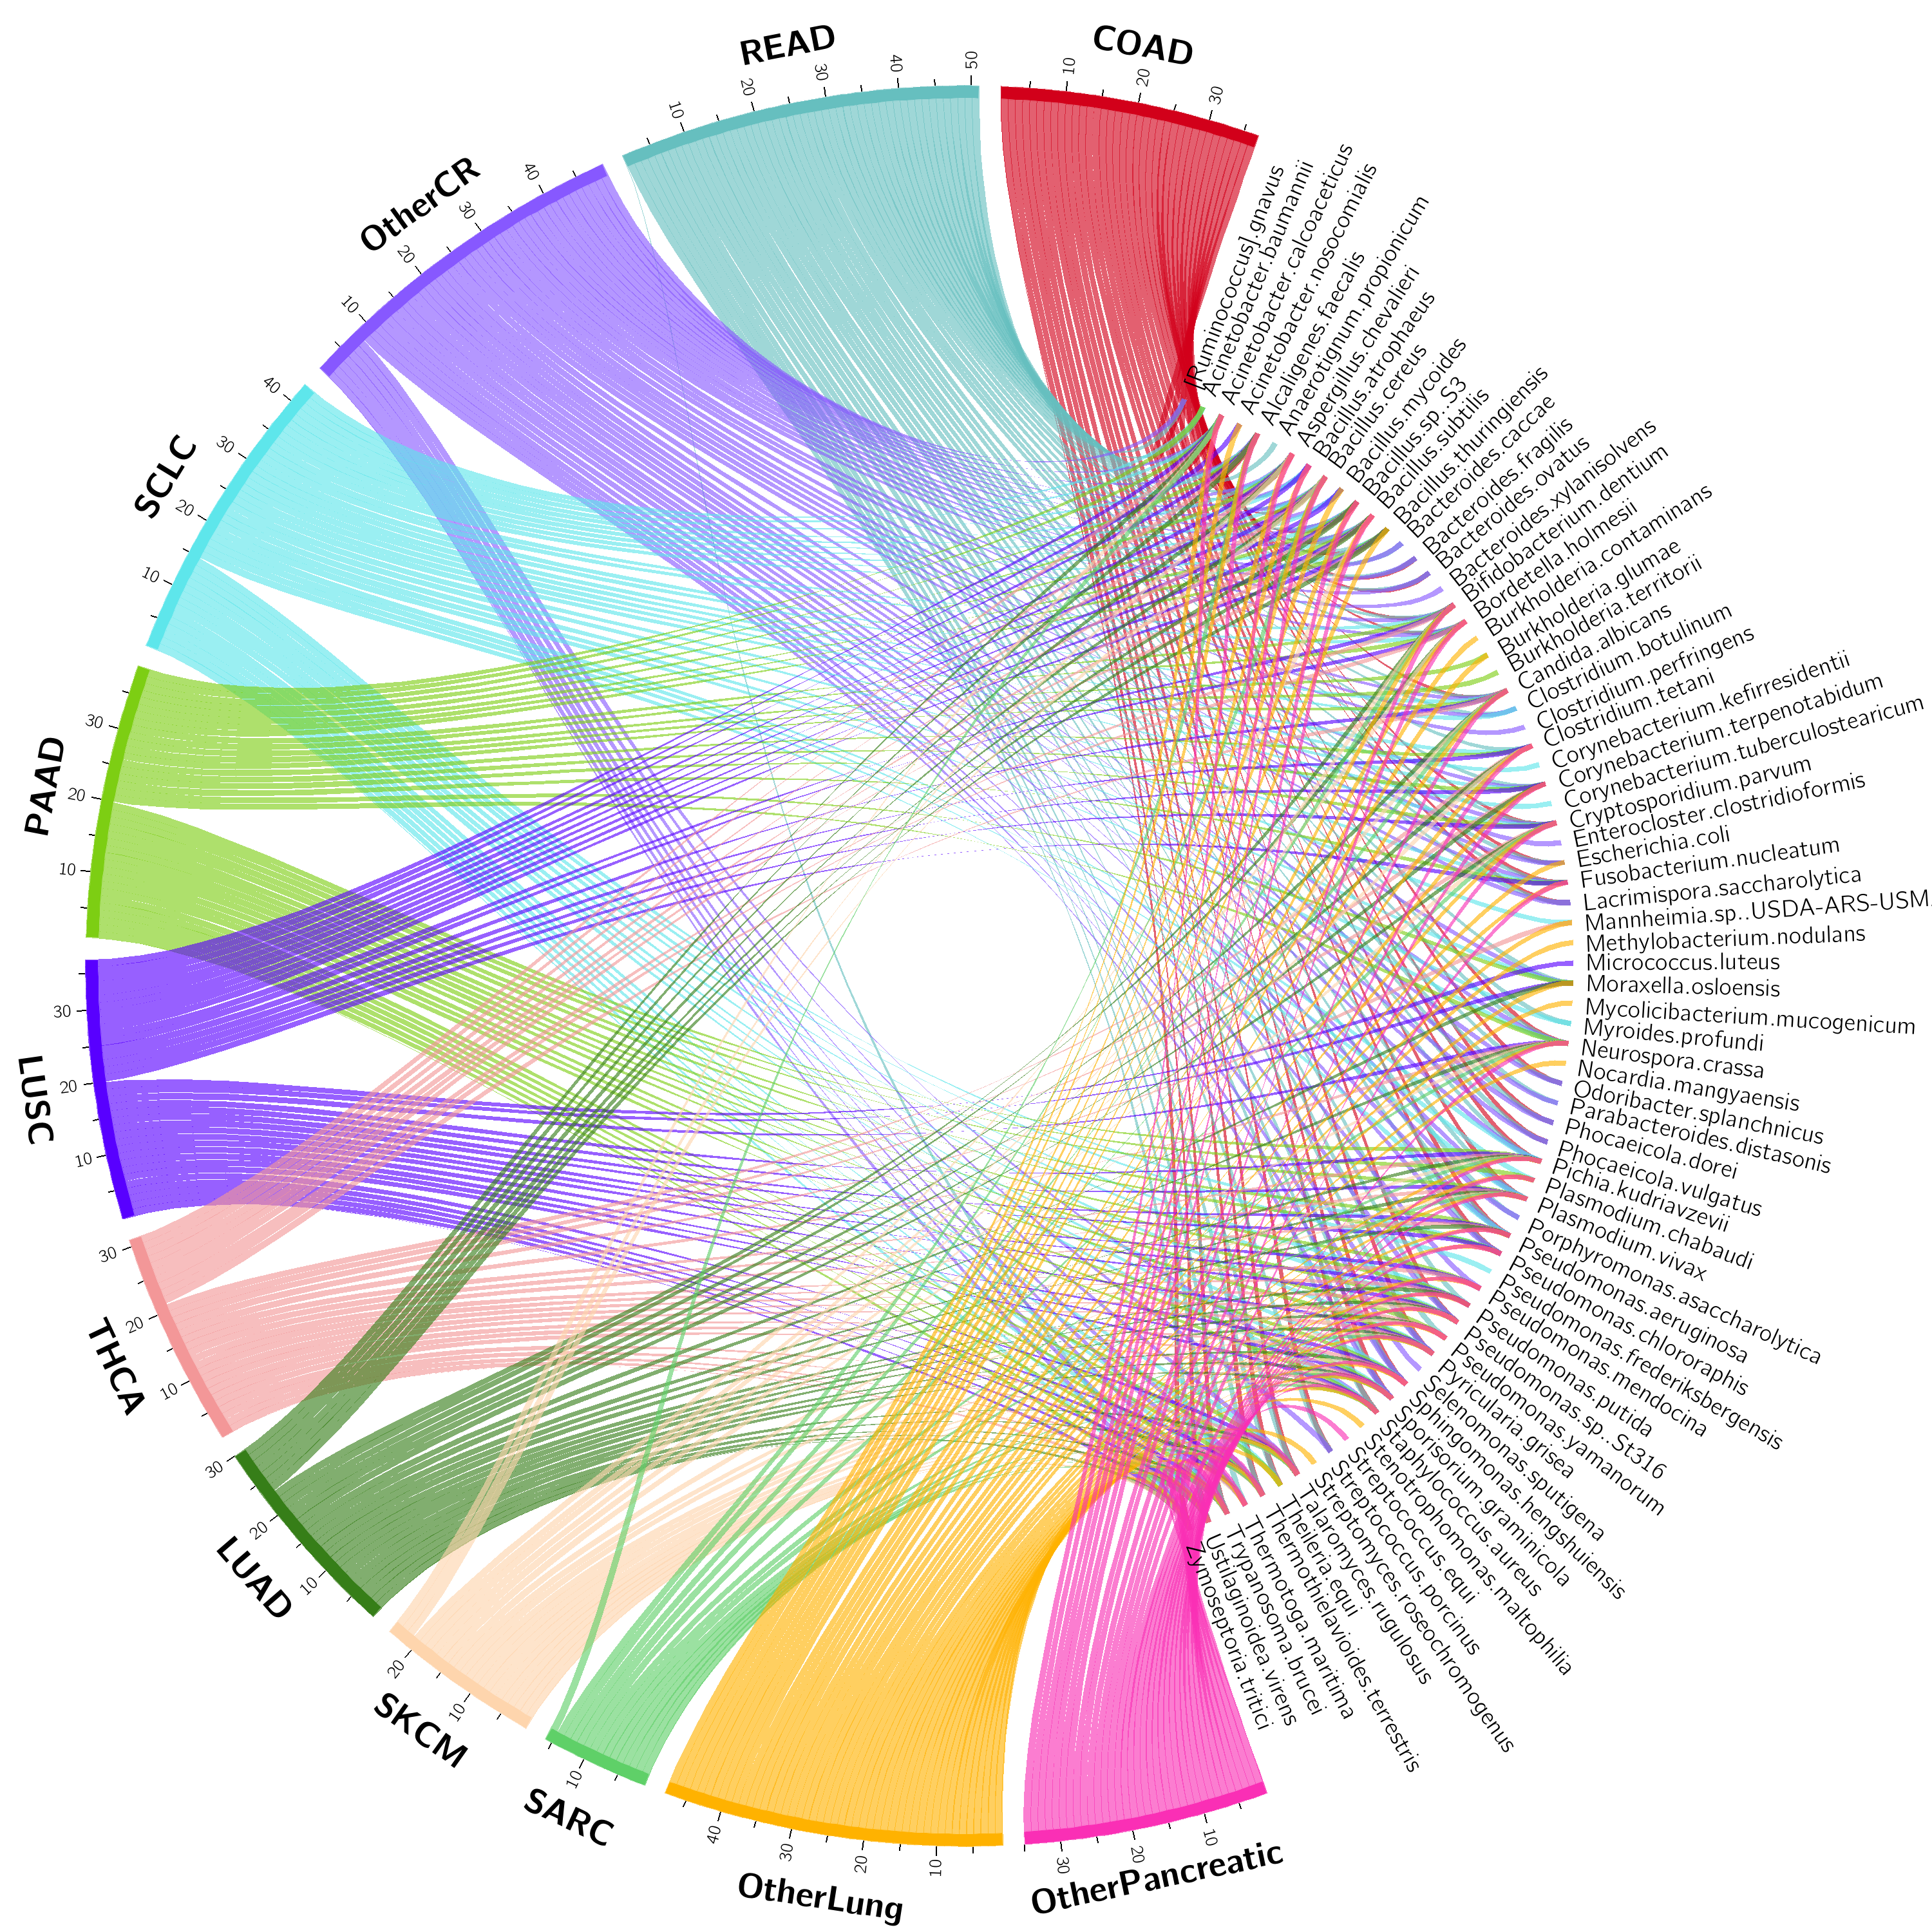
- Add tutorial for circos plot and network & upset plot
Updated:
- Rename to MEGA
Updated:
- Grammar and spelling errors
- Updated MEGA installation steps
Added:
- Complete workflow from raw abundance workflow and metadata labels to final prediction results
- Improved tutorial for GPU and CPU version usage
Added:
- Example data using a TCGA subset
- Example databases, including NJS16 metabolic database, NCBI taxonomy database
Added:
- GitHub published: https://github.com/OSU-BMBL/MEGA
- PyPI published: https://pypi.org/project/pyMEGA/
MEGA is developed and tested in the following software and hardware environment:
python: 3.7.12
PyTorch: 1.4.0
NVIDIA Driver Version: 450.102.04
CUDA Version: 11.6
GPU: A100-PCIE-80GB
System: Red Hat Enterprise Linux release 8.3 (Ootpa)
The following packages and versions are required to run MEGA:
- python: 3.7+
- cuda: 10.2
- torch==1.4.0 (must be 1.4.0)
- torch-cluster==1.5.4
- torch-geometric==1.4.3
- torch-scatter==2.0.4
- torch-sparse==0.6.1
- R > 4.0
- taxizedb (An R package for NCBI database)
Note: It is highly suggested to install the dependencies using micromamba (about 10 mins) rather than conda (could take more than 2 hours). If you don't want to use micromamba, just simply replace micromamba with conda in the code below.
if you have GPU available: check GPU version (CUDA 10.2)
if you only have CPU available: check CPU version
- Add channels using conda
conda config --add channels defaults
conda config --add channels bioconda
conda config --add channels conda-forge
- Create a virtual environment for MEGA
micromamba create -n MEGA_env python=3.7 -y
- Activate
MEGA_env
micromamba activate MEGA_env
- install
pytorch v1.4.0
micromamba install pytorch==1.4.0 cudatoolkit=10.1 -c pytorch -y
- install other required packages from pip
pip install dill kneed imblearn matplotlib tqdm seaborn pipx
- install
torch-geometric for pytorch v1.4.0
pip install torch-scatter==2.0.4 torch-sparse==0.6.1 torch-cluster==1.5.4 torch-spline-conv==1.2.0 torch-geometric==1.4.3 -f https://data.pyg.org/whl/torch-1.4.0%2Bcu101.html
- install
MEGA
pip install MEGA
- install
R and taxizedb
micromamba install R -y
- verify the installation
MEGA -h
- Add channels using conda
conda config --add channels defaults
conda config --add channels bioconda
conda config --add channels conda-forge
- Create a virtual environment for MEGA
micromamba create -n MEGA_cpu_env python=3.7 -y
- Activate
MEGA_cpu_env
micromamba activate MEGA_cpu_env
- install
pytorch v1.4.0
#micromamba install pytorch==1.4.0 cpuonly -c pytorch -y
pip install torch==1.4.0+cpu -f https://download.pytorch.org/whl/torch_stable.html
- install other required packages from pip
pip install dill kneed imblearn matplotlib tqdm seaborn pipx
- install
torch-geometric for pytorch v1.4.0
pip install torch-scatter==2.0.4 torch-sparse==0.6.1 torch-cluster==1.5.4 torch-spline-conv==1.2.0 torch-geometric==1.4.3 -f https://data.pyg.org/whl/torch-1.4.0%2Bcpu.html
- install
MEGA
pip install pyMEGA
- install
R and taxizedb
micromamba install R -y
- verify the installation
MEGA -h
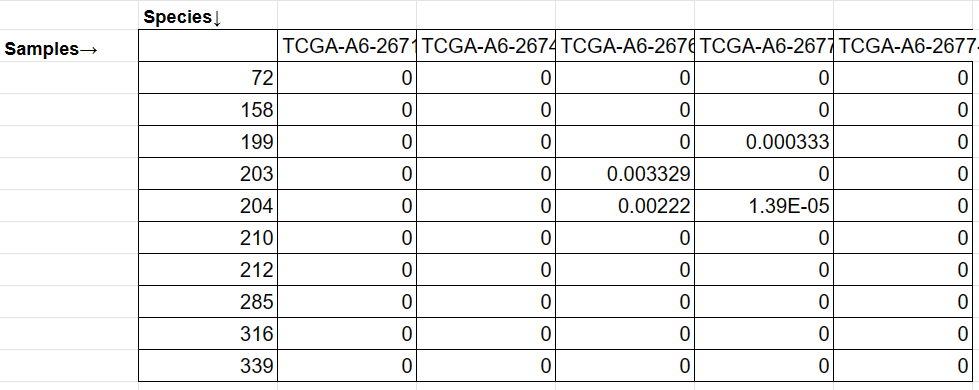
- Abundance matrix: A CSV matrix. The first column represents the species IDs or official NCBI taxonomy names. The first row represents the sample names. MEGA will automatically try to convert the species name to IDs when needed.
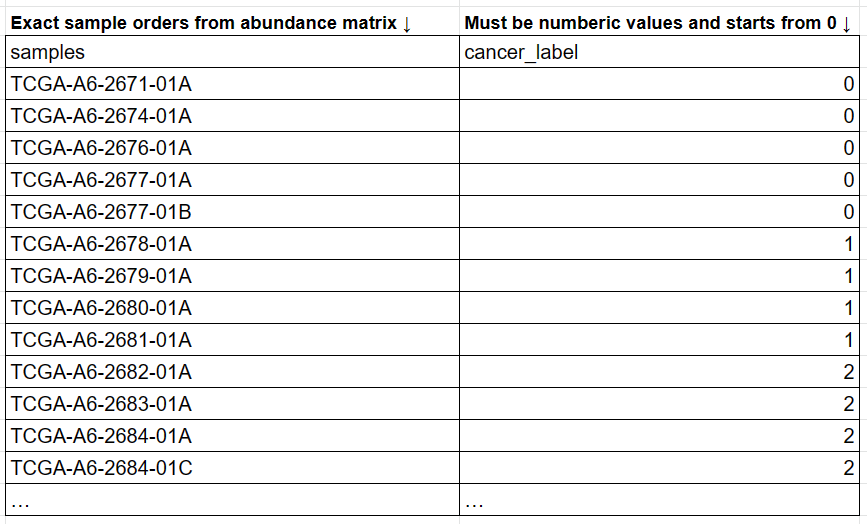
- Sample labels: A CSV matrix with a header row. The first column represents the species IDs or official NCBI taxonomy names. The first row represents the sample names. MEGA will automatically try to convert the species name to IDs when needed.
cre_abundance_data.csv: The abundance matrix has 995 species and 230 samples
cre_metadata.csv: The sample labels of the corresponding abundance matrix. It has 230 rows (samples) and 2 columns
NJS16_metabolic_relation.txt: Human gut metabolic relationship database (reference: https://www.nature.com/articles/ncomms15393). MEGA will load the built-in NJS16 metabolic database if users did not provide it. You can find the database content here
wget https://raw.githubusercontent.com/OSU-BMBL/MEGA/master/MEGA/data/cre_abundance_data.csv

wget https://raw.githubusercontent.com/OSU-BMBL/MEGA/master/MEGA/data/cre_metadata.csv
We will use the example data for the following tutorial.
input1: the path to the abundance matrixinput2: the path to the sample metadatacuda: which GPU device to use. Set to -1 if you only have CPU available
Running time:
- GPU version: about 15 mins
- CPU version: about 60 mins
MEGA -cuda 0 -input1 cre_abundance_data.csv -input2 cre_metadata.csv -db NJS16_metabolic_relation.txt -o ./out
MEGA -cuda -1 -input1 cre_abundance_data.csv -input2 cre_metadata.csv -db NJS16_metabolic_relation.txt -o ./out
use MEGA -h to check more details about parameters
INPUT1=cre_abundance_data.csv
INPUT2=cre_metadata.csv
DB=NJS16_metabolic_relation.txt
CUDA=0
LR=0.003
N_HID=128
EPOCH=30
KL_COEF=0.00005
THRES=3
OUTPUT=./out
MEGA -input1 ${INPUT1} -input2 ${INPUT2} -db ${DB} -epoch ${EPOCH} -cuda ${CUDA} -n_hid ${N_HID} -lr ${LR} -kl_coef ${KL_COEF} -o ${OUTPUT}
*_final_taxa.txt: Cancer-associated microbal signatures. This is an unstructured txt file separated by tabs. This is the final output file.
-
*_taxa_num.csv: normalized attention score for each species under each cancel label -
*_metabolic_matrix.csv: metabolic relationship network extracted from database -
*_phy_matrix.csv: phylogenetic relationship network extracted from NCBI taxonomy database -
*_attention.csv: raw attention matrix extracted from deep learning model
Check the README file in ./figures folder:
Check the README file in ./figures/circos folder:
Maintainer: Cankun Wang
Contributors:
- Cankun Wang
- Megan McNutt
- Anjun Ma
- Zhaoqian Liu
- Yuhan Sun
Contact us: Qin Ma qin.ma@osumc.edu.

