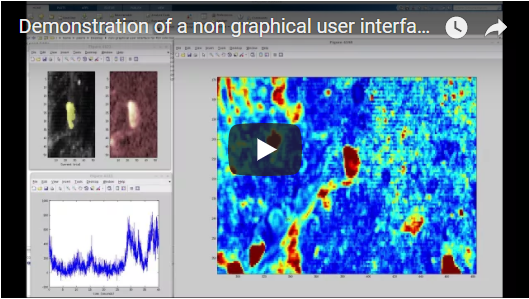
Drawing ROIs with a non-graphical user interface in Matlab
Drawing ROIs is a repetitive task when analyzing calcium imaging data. Despite automatization attempts (e.g., http://neurofinder.codeneuro.org/), in many cases drawing the ROIs manually is still the best solution. This script tries to simplify and streamline manual drawing of ROIs.
To try out the script provided here,
- Clone the repository locally
- Open
Demo_Analysis.min Matlab - Follow the notebook instructions and load the (small) demo calcium movie excerpt
- Once the graphical user interface appears: a) hit the
fkey and draw ROI b) use mouse to navigate.
In order to make this task as easy and intuitive as possible, I used a non-graphical user interface that relies on the user's knowledge of which keys and which mouse buttons to press (inspired by the Google Maps interface). I described the idea of this non-graphical user interface on my blog. The callback functions are defined in this subscript.
q : switch to anatomy only
w : switch to dF/F map (response)
e : switch to dF/F map (maximum)
r : switch to anamy overlayed with selected ROIs
t : switch to map of ROIs only
y : switch to map of local correlations
Mouse-click right : full view zoom
Mouse-click middle : pan (move mouse)
Scroll-wheel : zoom in and out
f : mouse-click left draws ROI outline
d : mouse-click left deletes ROI
g : mouse-click left shifts existing nearby ROI
z : mouse-click left automatically selects a circular ROI
x : mouse-click left automatically selects a ROI based on local correlations
1 to 9 : selects ROI size for semi-automatic ROI selection (x, z)
v : mouse-click left plots a map of local correlations of all image pixels to the selected location (cf. Junek et al.)
Close figure window : save selected ROIs and timetraces to the Matlab workspace.
The main script (Demo_Analysis.m) loads a 3D stack into the RAM and performs a couple of pre-processing steps before opening the non-graphical user interface (which is basically a simple image opened in Matlab, glued to a couple of key-stroke- and mouse-gesture-specific callback functions). The video linked above gives an overview over the keys (=shortcuts) and how to use them on a real calcium imaging dataset.
To adapt this script to your data, you want to change 'Demo_Analysis.m', not the rest of the code. This program can be used, as long as your data fit into the RAM. For larger single calcium recordings, other methods (that use only average images of anatomy or binned videos) must be used.
Variations of this script have been used to extract activity from calcium imaging data for the following applications:
- Imaging of mitral cells in zebrafish olfactory bulb
- Multi-plane imaging of 1000 neurons
- Imaging of zebrafish forebrain with GCaMP6f
- Imaging of zebrafish forebrain with OGB-1
- Imaging of hippocampal astrocytes in mice
- Imaging of hippocampal neurons in mice
- GRIN lens imaging of neurons in mouse habenula
- Imaging of excitatory and inhibitory neurons in mouse spinal cord
If you are using this toolbox for your scientific work, please refer to this paper as its first reference:
Rupprecht, Peter, and Rainer W. Friedrich. "Precise synaptic balance in the zebrafish homolog of olfactory cortex." Neuron 100.3 (2018): 669-683.
